3.4 Laser-Induced Fluorescence
LIF is a field-portable system that detects NAPL in the subsurface, including most refined fuels through heavy crude petroleum. LIF employs laser light to excite fluorescent molecules in NAPL, including jet fuel/kerosene, petroleum fuels/oils, coal tars, and creosotes. In addition, LIF detects fluorescent compounds added to nonfluorescent NAPLs. The system is deployed using either direct-push technology with hydraulic hammer or a CPT unit and provides qualitative to semiquantitative, real-time results. LIF does not typically respond to dissolved- or vapor-phase PAHs that result from the presence of NAPL. Fluorescence is logged as %RE: the response relative to the response from a reference emitter (RE) calibration standard.
LIF works by using a laser to excite PAH electrons in the NAPL to a higher-energy state. The excited PAH electrons return to ground state, releasing photons with wavelengths longer than the excitation laser. The resulting fluorescence is recorded by a detector. PAHs are fundamental components of most fossil fuels and tar-like substances. They are multiple aromatic ring structures, with the simplest being naphthalene (two rings). Gasoline contains fewer PAH than diesel. Tar-like substances such as asphalt and creosote contain greater weight percentages of both smaller and larger PAH molecules. Light is emitted by PAHs at specific wavelengths that are indicative of their size and degree of substitution. Smaller PAH molecules such as naphthalene emit shorter UV wavelengths; larger PAHs emit increasingly longer wavelengths that extend out into the red and even infrared spectrum.
Under the right conditions, the intensity of the fluorescence is proportional to the quantity of the NAPL present. In addition, different PAHs continue to emit fluorescence after excitation more or less quickly (differing lifetimes). Some NAPLs fluoresce for a short time [1 nanosecond (ns) to 2 ns] following excitation (for example, coal tar), whereas other NAPLs (for example, diesel) fluoresce for longer (50 ns to 100 ns) following excitation (Aldstadt 2002).
3.4.1 Tool Description
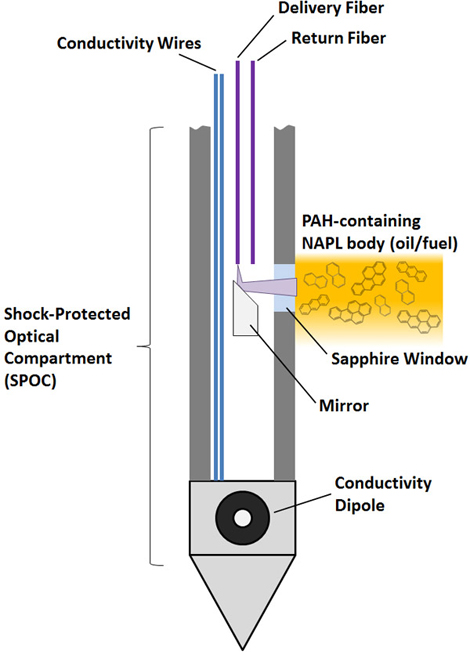
LIF system consists of several components: a direct-push (either percussion or static) system with attached sapphire-windowed probe, a pulsed laser, wavelength selection module, a photomultiplier tube, an oscilloscope, and a computer to control the components and record the data (Aldstadt 2002). The probe containing the sapphire window is pushed or hammered into the ground at a rate of about 2 cm/sec (ASTM 2010), with a measurement obtained approximately every 0.05 foot. A fiber-optic cable transmits the pulsed laser light downhole to the window where the light exits the probe and illuminates the adjacent soils and sediments and NAPL, if present (see Figure 3‑12). The laser excites aromatic compounds in the NAPL, which emit photons (fluorescence). A portion of the soil-scattered laser excitation along with a portion of detected fluorescence are returned to the surface through a second fiber-optic line, and results are displayed in real-time.
Figure 3‑12. LIF tool and associated sensor (EC).
Dakota Technologies, Inc. Used with Permission.
LIF’s versatility originates from its use of pulsed laser light as the excitation source. The laser light’s narrow excitation range and high power produce very low detection limits, while the pulsed nature of the light provides LIF the ability to measure fluorescence decay times. This ability to simultaneously detect the intensity, color and lifetime of the fluorescence outside the probe provides LIF with the capability to identify target fluorophores (fluorescent chemical compounds of interest) while simultaneously identifying non-target fluorophores (for example, false positives such as peat or minerals). Careful selection of excitation lasers also optimizes its ability to respond to certain target chemistries while ignoring others.
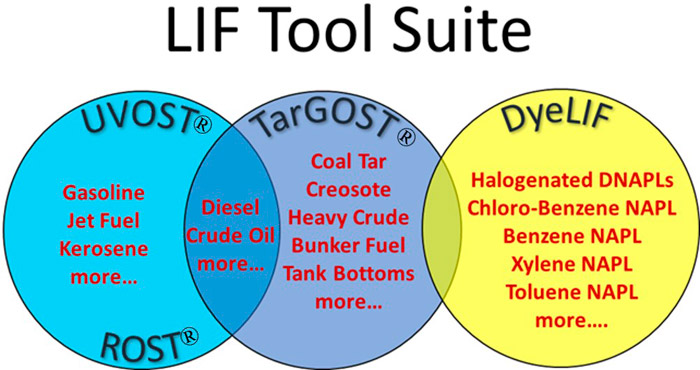
Optimizing detection capabilities for the unique chemistry of one class of NAPL means other NAPLs cannot be properly detected with the same LIF system. LIF technology developers have crafted a family of LIF systems that strike a balance between optimized detection of some important classes of NAPL and the ability to detect other NAPL classes. Although a universally responsive tool is technically feasible, its high cost and complexity is currently beyond industry’s ability to pay for its implementation. The three currently available LIF systems strike a balance between specialization and broad applicability. Figure 3‑13 illustrates how these LIF systems relate to each other and the various NAPL types commonly encountered in the subsurface.
Figure 3‑13. The three LIF systems and their associated NAPL types.
Dakota Technologies, Inc. Used with Permission.
This LIF tool description is divided into three parts according to three major NAPL classes and LIF systems that were designed to detect them. The section headings mirror the elements described in Figure 3‑13.
- The UVOST® and Rapid Optical Screening Tool (ROST®) LIF systems are nearly identical UV-laser-based systems optimized to detect most petroleum products, oils, and lubricants. They detect LNAPL common to most releases at gas stations, refineries, pipelines, and bulk-handling facilities.
- TarGOST® is a visible-wavelength laser system that was designed to detect heavier hydrocarbons. These heavy NAPLs are commonly DNAPL due to their higher density, and include coal tars, creosote, tank bottoms, bunker (marine) fuel, and chlorinated solvents that were used for degreasing (used for cleaning items contaminated with hydrocarbons).
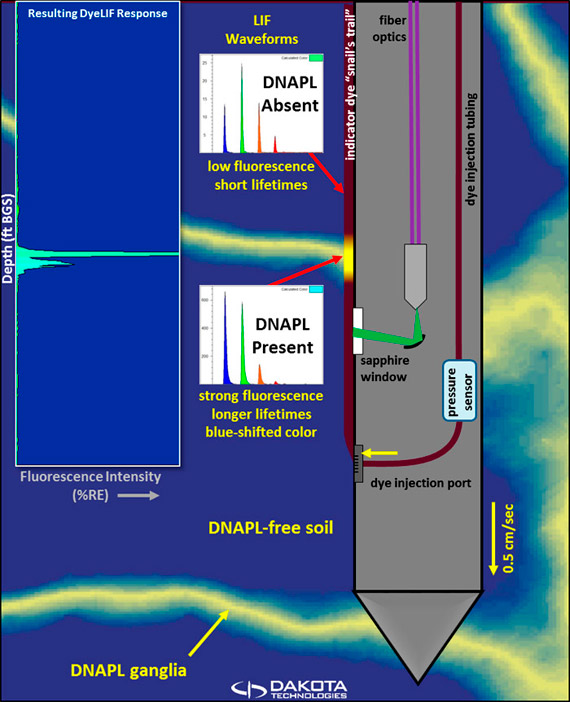
- The DyeLIF is a dye-enhanced laser-induced fluorescence system designed for chlorinated solvents and similar compounds that do not naturally fluoresce. DyeLIF is similar to TarGOST® but involves the injection of a fluorescent marker dye that renders the NAPL fluorescent prior to the arrival of the LIF probe.
UVOST® and ROST® were the first time-resolved LIF systems to be commercialized and are closely associated with the generic label “LIF.” The description in Section 3.4.1 and Section 3.4.1.1 uses this class of LIF to discuss the general hardware and tool functions shared by all LIF systems. The subsequent sections describing TarGOST® and DyeLIF systems focus on the unique attributes of those systems, challenges typically encountered when characterizing their unique classes of target NAPL, and best practices for success for deployment.
LIF works by using a laser to excite PAH electrons in the NAPL to a higher-energy state. The excited PAH electrons return to ground state, releasing photons with longer wavelengths. The resulting fluorescence (%RE: the response relative to a reference emitter calibration standard) is recorded by a detector. PAHs are fundamental components of most fossil fuels and tar-like substances. They are multiple aromatic ring structures with the simplest being naphthalene (two rings). Gasoline contains fewer PAH than diesel. Tar-like substances such as asphalt and creosote contain greater weight percentages of smaller and larger PAH molecules. Light is released by molecules at specific wavelengths that are indicative of the compounds being excited. Smaller PAH molecules such as naphthalene emit shorter UV wavelengths; larger molecules emit increasingly longer wavelengths that extend out into the red and even infrared spectrum. Under the right conditions, the intensity of the fluorescence is proportional to the quantity of the compound present. In addition, different PAHs emit radiation after excitation more or less quickly (differing lifetimes). Some NAPLs fluoresce for a short time [1 nanosecond (Ns) to 2 Ns] following excitation (for example, coal tar), whereas other NAPLs (for example, diesel) fluoresce for longer (50 Ns to 100 Ns) following excitation (Aldstadt 2002).
When LNAPL and DNAPL are present in the subsurface environment, delineating their occurrence can be difficult with traditional methods, especially in heterogeneous geology. To gain a comprehensive understanding of the subsurface contaminant distribution, many soil samples need to be collected and analyzed at great cost. Modified forms of LIF have been successful at detecting chlorinated compounds (which are often DNAPL) as described above, and, in some cases, chlorinated DNAPL contains sufficient fluorophores to allow LIF detection without modification.
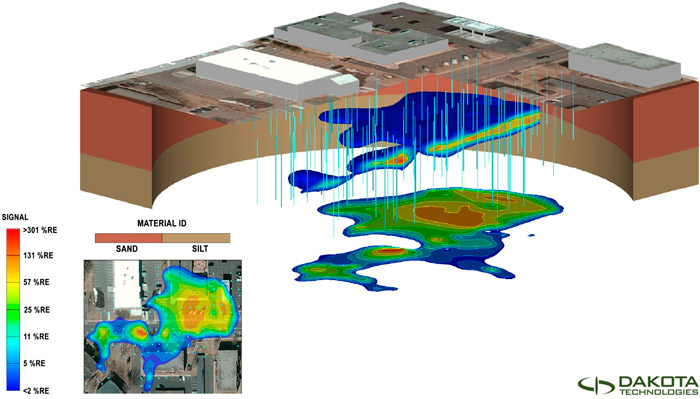
When used in conjunction with direct-push delivery, LIF can rapidly obtain high-density diagnostic data over a wide area and to sufficient subsurface depth to provide a cost-effective delineation of NAPL phase “body”. The large amounts of gathered information can be displayed on a borehole-by-borehole basis or sitewide using 3-D visualization software (see Figure 3‑14). Multiple LIF logs from NAPL release sites provide a basis for a detailed CSM (St. Germain 2011). In the case of some refined fuels, LIF can help the investigator discriminate between weathered and nonweathered LNAPL based on the fluorescence’s spectral (color) and lifetime properties. Seek guidance from the vendor and consider results of any validation sampling or benchtop testing when determining a proper NAPL threshold for the site. When used in conjunction with other downhole tools (for example, CPT, EC, or HPT) the investigator can gain a better understanding of how site geology is controlling the contaminant distribution.
Figure 3‑14. CSM with LIF logs plotted in 3-D (colors are relative %RE with red being highest)
Source: Dakota Technologies, Inc., Used with Permission
3.4.1.1 UVOST®
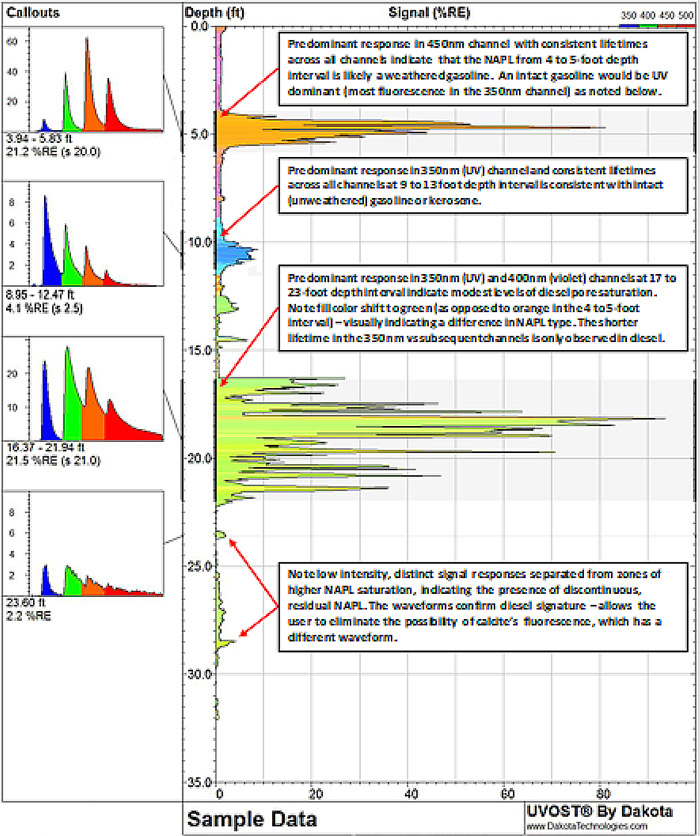
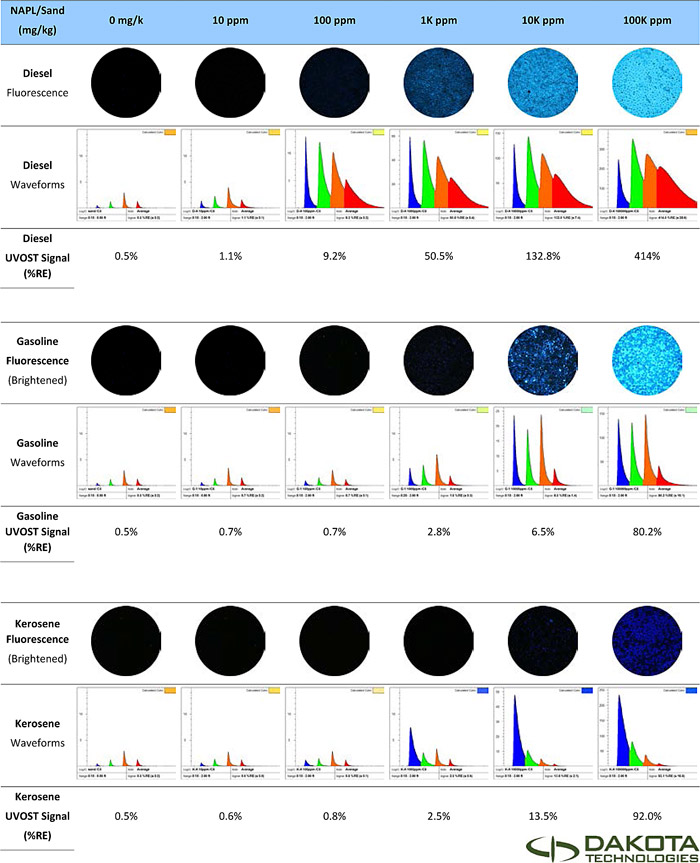
As discussed in the tool description (Section 3.4.1), a portion of the soil-scattered laser excitation along with a portion of detected fluorescence are returned to the surface through a second fiber-optic line, and results are displayed in real time. The scattered laser light used for UVOST® is filtered out from the fluorescence return fiber, after which the light is split into four wavelength channels each of which responds to different size distributions of PAHs. Using different lengths of fiber optics, these four channels are delayed in time before being directed to the photomultiplier tube detector for conversion from light intensity to electric current. The current from the photomultiplier tube is sent to a digital oscilloscope that measures the intensity and the decay rate of the four wavelength channels to generate what is called a waveform. The waveforms, along with depth information, are analyzed and displayed graphically in real-time with signal strength; waveforms are normalized to the %RE waveform (Aldstadt 2002). Figure 3‑15 presents an example UVOST® log. The shape of the waveform is representative of both the color and lifetime of the fluorescence, which provides insight into the fuel type (see Figure 3‑16). Increasing NAPL in the soil pores results in increasing fluorescence, causing increases in the size of the waveform.
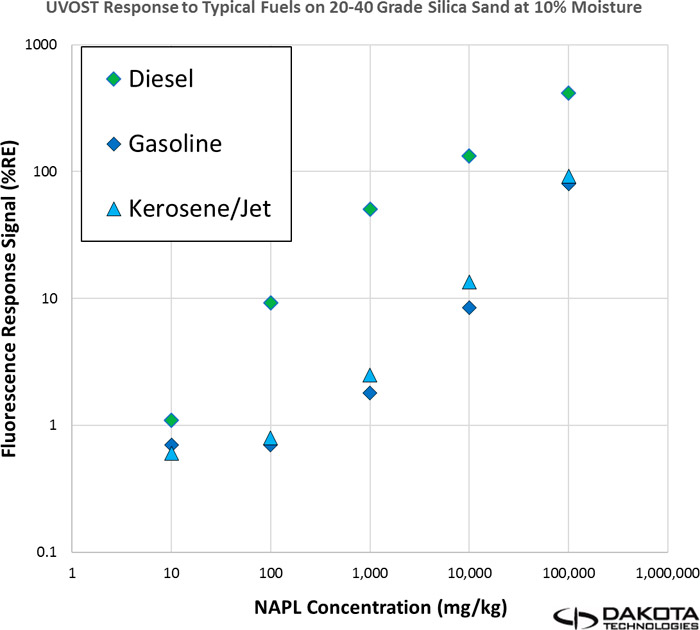
In general, the intensity of the total fluorescence response is expected to increase with increasing NAPL pore saturation. In benchtop tests (where the soil and NAPL are held constant), the behavior between NAPL content and %RE is typically linear across three to four orders of magnitude depending on the NAPL and %RE is typically linear (monotonic) across three to four orders of magnitude depending on the NAPL and soil types (Coleman 2006); (St. Germain and Martin 2008). Such monotonic performance through several orders of magnitude is typical across all LIF systems, until the NAPLs become too rich in PAHs and internal quenching mechanisms begin to dominate. At that point the response begins to weaken; plateaus across all concentrations; and, in many cases, decreases with increasing NAPL concentration. A monotonic relationship between fluorescence intensity and NAPL pore saturation is assumed but is not guaranteed due to a host of other factors that can enhance or quench this ideal behavior. It is, therefore, important to fully understand the numerous factors affecting the fluorescence response prior to interpreting LIF logs. Figure 3‑17 illustrates the monotonic (linear) response of the same data shown on Figure 3‑16.
Figure 3‑15. Example UVOST® log.
Source: Dakota Technologies, Inc., Used with Permission
Figure 3‑16. Fluorescence photos (308-nm laser) with UVOST® waveforms for common NAPLs in 20-40 mesh silica/quartz sand at 10% moisture.
Source: Dakota Technologies, Inc., Used with Permission
Figure 3‑17. UVOST® response (%RE) of common fuels across a wide range of NAPL concentrations.
Source: Dakota Technologies, Inc., Used with Permission
3.4.1.2 TarGOST®
Field trials of existing ultra-violet excitation LIF tools were found to consistently generate erroneous data when applied to “heavy NAPL” such as coal tars, creosotes, and bunker fuels. Due to severe NAPL fluorescence quenching caused by large PAHs combined with unexpected bright fluorescence of small dissolved-phase PAHs, Dakota Technologies, Inc. developed the TarGOST® to overcome these confounding behaviors. The first successful field trials of TarGOST® delineating coal tar at manufactured gas plants are documented by (Coleman 2006).
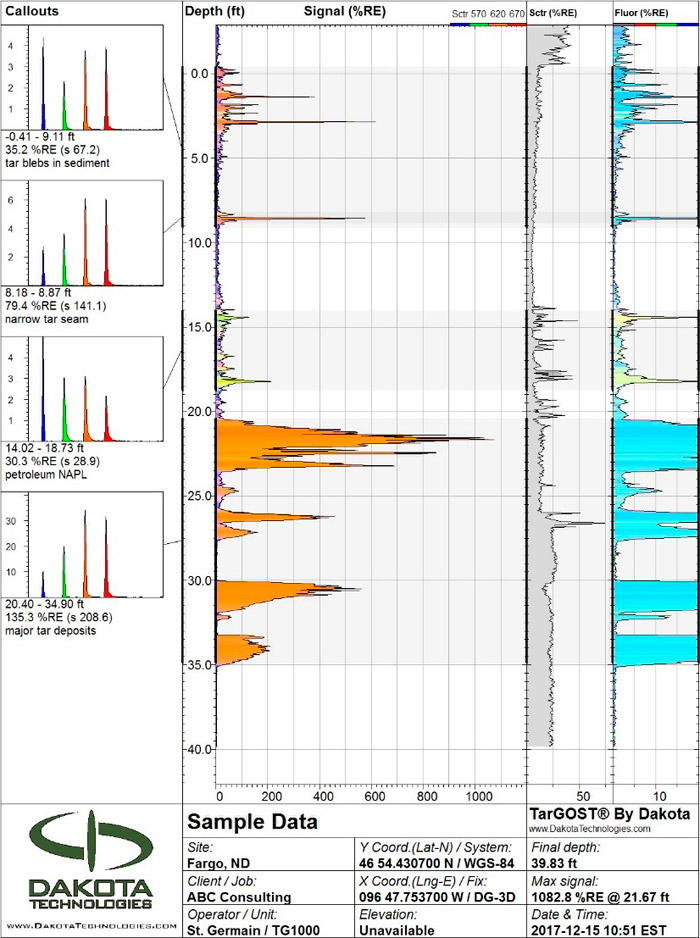
Shifting the excitation laser to longer wavelength (weaker energy) light targets the larger PAH molecules directlysince 2- and 3-ring PAHs do not absorb this longer wavelength light. In addition, TarGOST® shifts to detecting the longer wavelength fluorescence emitted by very large PAH molecules, which eliminates some degree of the quenching. Even with this optimization, multiple-wavelength waveforms (and their associated lifetime decay) remain a crucial component in differentiating between target NAPL fluorescence and false positive fluorescence of peat, meadow mat, wood, calcites and the like. The TarGOST® system has been used at hundreds of coal tar, creosote, and heavy fuel projects to date. An example TarGOST® log is presented as Figure 3‑18.
Figure 3‑18. Example TarGOST® log.
Source: Dakota Technologies, Inc., Used with Permission
The advantages of the TarGOST® system over UVOST® LIF for heavy NAPL include the following:
- a robust response to most coal tars and creosotes
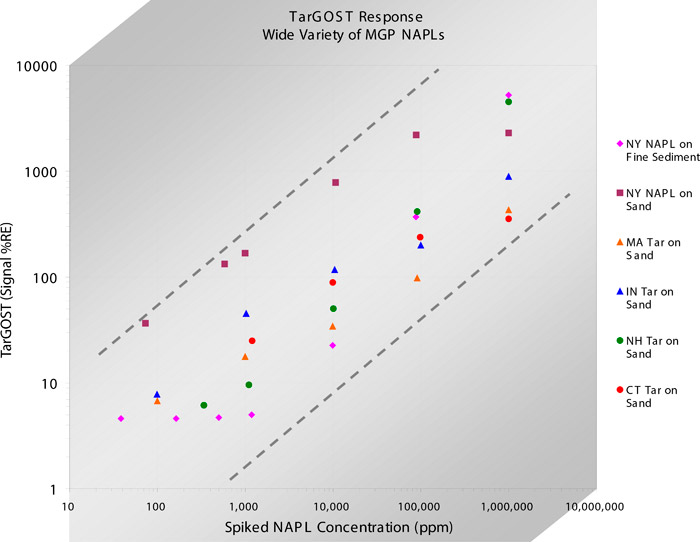
- excellent linearity of response for coal tars and creosotes (see Figure 3‑19) across many orders of magnitude
- no possibility of response to dissolved-phase PAHs since the TarGOST® laser is incapable of exciting water-soluble PAHs
Figure 3‑19. Example TarGOST® responses versus heavy NAPL content (mg/kg).
Source: Dakota Technologies, Inc., Used with Permission
The following facts are important to keep in mind when characterizing heavy NAPL with a system like TarGOST®:
- Coal tars, creosotes, bunkers, and other DNAPLs distribute themselves in highly heterogenous fashion.
- NAPL denser than water may be distributed deeper than LNAPL.
- Wood treatment sites and manufactured gas plants are typically located along waterways, so the likelihood of encountering false positive fluorophores such as wood, calcareous sands, shell hash, peat, meadow mat, and associated wetland debris is high.
- A typical detection limit range for most mixed-component DNAPL (for example, coal tars and creosotes) is 100 milligrams (mg) to 1,000 mg NAPL per kilogram (kg) soil. This limit of detection is close to human observation.
The following actions are recommended when implementing the TarGOST® system:
- Contact the TarGOST® vendor to arrange for bench-top testing of representative NAPLs from the site.
- Do not apply too high of a %RE threshold to the site. While the long-term average threshold indicative of tar and creosote has ranged from 7% RE to 50% RE, each site is unique and requires site-specific interpretation.
- Budget for limited targeted validation sampling in conjunction with the NAPL threshold determination.
- Average the %RE over a selected depth range rather than choosing narrow peak TarGOST® values spanning just one or two readings.
3.4.1.3 DyeLIF
The DyeLIF tool is a specialized form of LIF that was developed to improve the detectability and reliability of LIF for chlorinated NAPLs (St. Germain et al. 2014);
(Einarson et al. 2018). The DyeLIF tool injects a small amount (<1 g per 50-ft log) of proprietary fluorescent dye (noncarcinogenic and relatively nontoxic) into the formation several centimeters ahead of the LIF sensor. The dye mixes with and elicits a response from the nonfluorescing NAPL, as described in more detail below. In addition, dye injection pressure and flow are monitored to produce estimated hydraulic conductivity values, similar to the HPT (see Section 3.6.1.1).
As previously described, NAPL fluorescence depends on conditions such as PAH content, solvent-body conditions, and fluorescence excitation and emission energies. The molecular structures of chlorinated DNAPLs such as PCE and TCE lack aromaticity and therefore do not fluoresce. However, chlorinated NAPLs can contain remnant PAHs from manufacturing processes (for example, picked up while cleaning or degreasing), and naturally occurring fluorophores solvated after release can fluoresce sufficiently to allow for detection (Kram et al. 2004). Unfortunately, false negatives remain likely; therefore, UVOST® and TarGOST® should not be used for chlorinated NAPL detection without first establishing that the site-specific NAPL fluoresces sufficiently by bench testing of site DNAPL if available.
Figure 3‑20 illustrates the concept of injecting dye below the LIF sensor to render NAPL fluorescent for subsequent detection. Rather than changing from a black to red color like Oil Red O or Sudan IV dye shake tests (Cohen et al. 1992), theDyeLIF dye fluoresces orders of magnitude more intensely when it contacts NAPL. It also changes color and the fluorescence lifetimes increase – all of which are recorded in the DyeLIF waveforms. The dye currently used in the DyeLIF tool fluoresces more intensely and is more universally effective than the original dye, which was robustly responsive to TCE and PCE but lacked sufficient response to reliably detect some other classes of DNAPL. The current dye performs well with monoaromatics such as benzene and toluene as well as chlorobenzenes, dichloroethane, trichloroethane, TCE, PCE, and chloroform. DyeLIF is expected to respond to nearly all halogenated solvents but conducting site-specific NAPL bench testing is always advised. Nitrobenzenes are a notable exception, having been found to quench both versions of DyeLIF indicator dye fluorescence significantly.
Figure 3‑20. Conceptual diagram showing a DyeLIF probe passing through a DNAPL-impacted soil formation.
Source: Dakota Technologies, Inc., Used with Permission
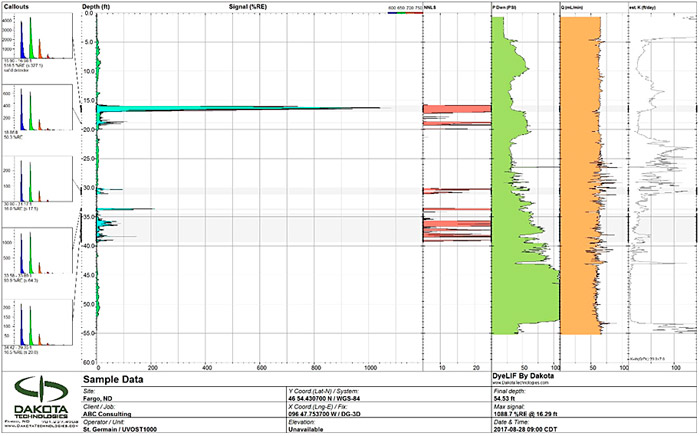
Figure 3‑21 shows a typical DyeLIF field log. The results of a nonnegative least squares (NNLS) analysis data are plotted (in red) to indicate zones of chlorinated NAPL-exclusive fluorescence (false positives are removed vis NNLS analysis).
Figure 3‑21. Example DyeLIF log.
Source: Dakota Technologies, Inc., Used with Permission
he following actions are recommended when implementing the DyeLIF system:
- Because investigating chlorinated NAPLs is always challenging, time should be invested in discussing the applicability of the DyeLIF tool to the site with the vendor prior to initiating work.
- It is important to note that DyeLIF is unresponsive to dissolved-, vapor-, or adsorbed-phase chlorinated solvent contamination, making it truly NAPL-specific.
- This tool, like TarGOST®, is relatively unresponsive to light fuels like kerosene and gasoline.
- DyeLIF responds well to diesel and heavier fuels, which can interfere greatly with using the tool for specifically detecting chlorinated solvents NAPLs.
- The DyeLIF responds monotonically to chlorinated NAPL saturation when the soil grain size is fixed. Finer soil particles dampen the response while coarser grained soils enhance the response.
3.4.1.4 Proper LIF Selection
Selecting the proper LIF tool to target specific NAPL is essential. Some LIF systems are blind to certain NAPLs, many of which carry higher risk than the target NAPL. For example, UVOST® is designed to characterize light-fuel LNAPL and is unresponsive to many coal tars, which are DNAPLs with potentially hundreds of times more toxicity and recalcitrance than diesel. The Tar-specific Green Optical Screening Tool (TarGOST®) system, on the other hand, is designed for coal tar delineation but fails to detect gasoline. Selecting the inappropriate LIF tool may result in overlooking contaminants and wasting money, effort, and remediation efficacy. Before selecting an LIF system for a project, contacting the developers of LIF systems is recommended. They can answer questions, provide guidance in selecting the appropriate system, and can possibly provide testing services for a target NAPL or even advise whether LIF is appropriate for a site.
3.4.2 Technical Limitations
The technical limitations of LIF systems are similar to other direct-push that are constrained by problematic geology, detection confirmation issues, NAPL detection, NAPL detection and interferences.
3.4.2.1 Geologic Setting
LIF is typically advanced through unconsolidated overburden where it has the same limitations as other direct-push tools. However, LIF has been successfully used in harder bedrock by advancing direct-push technology with LIF in a previously cored borehole filled with a sand and organoclay mixture (Hale 2011).
3.4.2.2 Confirmatory Sampling
Confirmatory soil sampling for comparison to LIF results can prove unsuccessful for the following reasons:
- Sampling in NAPL-friendly geology (such as sands, gravels) can result in poor correlation between sample results and the subsurface NAPL location, possibly due to mismatching depths between sampling methods (especially when NAPL occurs in thin horizons).
- Coarser materials, which often contain substantial NAPL, can be more difficult to sample or retain in a sampling device. Be prepared for sampling difficulty exactly where it’s critical you get good recovery.
- Confirmation samples are often collected from different boreholes, and, although the boreholes may be close to the LIF being confirmed, natural lithologic heterogeneity can be significant over short distances. To control for this, laboratory confirmation sample splits can be reanalyzed with LIF (benchtop testing) to ensure the same sample is measured by both the LIF and confirming laboratory technique. This approach is recommended to assure the two methods are analyzing the same sample.
- The laboratory tests selected may not include the primary compounds present in the NAPL if the NAPL has not been separately characterized. If laboratory results do not indicate detection, then further laboratory analysis is required to identify fluorescing material.
3.4.2.3 Detection Limitations
LIF does not generally detect dissolved- or vapor-phase impacts related to NAPL. Unusual NAPLs that have not been classified as detectable or NAPL for which there is no information on the LIF response should always be sent to the vendor for testing. This is critical to success, because false negatives (NAPL in the subsurface that don’t respond to LIF) result in an uncharacterized contaminant mass unless there is significant co-sampling – a potentially daunting and expensive task at NAPL release sites. Knowing the limitations of the ability of a technology to detect all NAPL types that might exist at a site is critical to success for any sensor, including LIF. Aviation gasolines are a notable example for all fluorescence systems, having failed to generate a satisfactory LIF response at a number of sites and in laboratory testing.
3.4.2.4 Interferences
False positives can be caused by organic matter, sea shells, peat, calcite (limestone), and calcareous sands. These false positives can often be recognized and removed from the CSM because they typically generate a signature (waveform) that varies from that of the NAPL, giving investigators some evidence for identifying false positives versus NAPL. Disposal sites such as landfills also contain anthropogenic materials that often fluoresce (for example, plastic and paper), which interferes with LIF. Other materials that can cause false positives include peat and meadow mat, asphalt, stiff and viscous tars, tree roots, sewer lines, coal, and quicklime (St. Germain 2008).
Fine-grained, organic-rich sediments are challenging. High surface area and small grain size soils (for example, clays) can hide NAPL so that it cannot be detected by LIF; under these conditions, the NAPL in the interstitial spaces of clay is not visible to the sensor unless there is clear line of sight. LIF sensitivity to petroleum hydrocarbons in soil has been shown to be inversely proportional to the available surface area of the soils. Sandy soils tend to have a much lower total available surface area than clay soils, so hydrocarbon compounds in sandy soils generally yield a higher fluorescence response than they do in clay-rich soils. These environments can result in high backgrounds readings and wandering baselines that can be deleterious to proper interpretation and can mask smaller signals, often requiring advanced data analysis.
Other factors related to soil type that can affect fluorescence response include mineralogy, degree of soil aggregation, and moisture content (Apitz et al. 1993). Increasing water content tends to impede LIF response in sand but enhances response in clay, while having negligible effect in sand-clay mixtures where their respective effects offset one another (Apitz et al. 1993).
3.4.3 Data Collection Design
General information about ASCT data collection and design is provided in Section 3.1.5. Additional considerations for LIF include NAPL type (for example, gasoline, diesel, kerosene, jet fuel, crude oil) and the age of the release.
3.4.4 Quality Control
QC standards must be established and followed to ensure reliable data. In addition to comprehensive operator training (which may be verified prior to commencing work) and an operator track record of successful use, approved field procedures must be understood and followed before, during, and after LIF activities.
3.4.4.1 Quality Control Prior to Use
During project planning stages, site conditions and the project objectives should be evaluated to determine if LIF is the appropriate tool. If desired, NAPL and soil samples can be collected and tested to assess NAPL response and the potential for false positives and background interference. It should be noted that benchtop NAPL analysis can also be performed after fieldwork, but this delay eliminates the possibility of factoring these responses into real-time interpretation of the logs.
Prior to beginning work, discuss with the operator how hard they should push when advancing becomes difficult so that the likelihood of breaking equipment or getting the equipment stuck is reduced. The equipment operator should complete the following prior to advancing LIF tools and systems:
- Test the equipment, and verify it is in good working order. This includes:
- Ensure proper setup and alignment of the shock-protected optical compartment and evaluate and mitigate fogging, if necessary.
- Recording and evaluating the %RE
- Recording and evaluating the system background response (nothing on the sapphire window). Foreign materials inside the probe can fluoresce, masking the response occurring from outside the window in the formation. Background should never exceed 1% RE, with <0.5% preferred, if possible. This makes small responses outside the window easier to detect and interpret.
- Acquire baseline soil response (for example, from calcium-carbonate-rich soils.) to understand whether small contaminant responses may be masked. This is usually in an area of the site where no previous impacts have been reported. If such an area has not been identified, the background response usually can be determined during LIF advancement from intervals that do not appear impacted.
- If product sample(s) are available, apply to sapphire window to record site-specific response(s). Low-viscosity NAPLs such as gasoline need to be applied to a small volume of moist sand piled onto the probe window so as to prevent thin-sheeting and evaporation that may produce artificially low fluorescent responses.
3.4.4.2 Quality Control During Use
During fieldwork, the equipment operator must repeat the following quality control measures prior to every log:
- Verify the shock-protected optical compartment is in good working order and there is no fogging.
- Record the %RE to calibrate the tool for that log.
- Record the system background response (clean window). Again, background should never exceed 1% RE, with <0.5% preferred, if possible.
The waveforms and other concurrent outputs should be evaluated throughout the LIF advancement to identify potential non-NAPL materials, potential background interference, or evidence that a previously unidentified form of NAPL exists at the site.
The advancement (push) rate, typically about 2 cm/sec, must be monitored for deviations to account for associated response variations. The rate should not exceed that specified for the method. Although advancement rates slower than the standard rate produce higher data densities with minimal risk to data quality, these slower rates negatively impact daily production.
3.4.4.3 Quality Control After Use
Following each LIF push, the operator should inspect the sapphire window for fogging, chips, cracks, or other issues.
Soil samples may be collected (or existing samples used) to confirm potential non-NAPL or unidentified NAPL signatures and to understand lithology that may affect response (for example, porosity effects from clayey versus sandy material) and natural soil fluorescence interference as described in Section 3.4.2.4. These results are incorporated into the final report from the LIF operator.
Targeted follow-up soil sampling (when data suggest the need) may be useful. However, sample results may not always correlate well with LIF results. Multiple lines of evidence are necessary, including lithology, other soil and groundwater samples, visual observations, and field testing. To achieve this goal, the LIF operator may place recovered materials onto the LIF system, either on-site or by sending samples to the vendor postinvestigation.
After completing the investigation, it is critical that an individual with LIF data interpretation experience (for example, technology developer) assists in reviewing the LIF data in a sitewide context. The LIF waveforms contain a wealth of information that can provide insights into fuel types, weathering, false positives, and unknown NAPL existence and can be the key to differentiating NAPL from mineral fluorescence. If no individual on the project team has the experience necessary, the LIF vendor should be contacted for assistance.
3.4.5 Tool and Data Misuse
Like results from similar investigation methods, LIF results should not be interpreted without understanding the CSM and, if available, other lines of evidence. Because of the potential for interferences and sequestered NAPL (in fine-grained materials), results must be maintained in the context of available information and investigation requirements. For example, monotonic behavior between fluorescence intensity and NAPL pore saturation may be assumed but is not guaranteed. In addition, applying an inappropriate fluorescence method may result in lack of NAPL detection.
Possible misinterpretations of LIF data may result during data transformation or interpolation. Statistical methods may incorrectly represent datasets if the data condition is not well understood or the wrong method is used. The following common mistakes are made during LIF implementation and data interpretation:
- failure to have the LIF vendor perform testing on NAPL samples (if available) to ascertain that the site NAPL has an appropriately bright fluorescence response and to select the most suitable LIF technology (most intense and unique waveform possible)
- failure to identify and remove false positives by comparing other lines of evidence to waveforms, clustering diagrams, and log fill color
- failure to recognize and consider that different NAPL have inherently different fluorescence intensities (for example, applying diesel intensity values to gasoline LIF causes an underestimation of gasoline NAPL impacts)
- applying too high of a %RE threshold to gasoline sites (using 5, 10, or 20% RE as indicative of NAPL) (Note: Even the smallest response indicates gasoline NAPL as long as the waveform (blue-shifted with long lifetimes) supports it.
- failure to recognize that gasoline weathers rapidly and its fluorescence covers a wide spectrum of signatures, eventually fading to an orange fill and waveform that is easily confused with limestone fill and calcites
- failure to understand that the limits of detection must be based on benchtop or in situ multiple lines of evidence
- failure to apply LIF well below the groundwater surface, which results in overlooking substantial trapped NAPL below the water table
- failure to budget for limited targeted validation sampling, leaving all stakeholders in doubt as to how to properly interpret data
- Choosing the single highest LIF value rather than averaging the RE over some minimum depth range
- failing to select a depth range (over which LIF data are averaged) that correctly represents subsurface conditions
- Failing to assess the applicability of the different LIF techniques for each site, even if the responses among them may be related
- failure to appreciate that extremely short-lived and red-shifted responses (UVOST®) can indicate the existence of unreported dramatically high PAH-content NAPL like creosote or coal tar
- waiting too long after the project to review and interpret data (before memories fade)
- Failure to understand that additional LIF logs and other data are required to understand how a LIF log represents the general surroundings.
3.4.6 Case Studies
The following case studies demonstrate potential applications of LIF systems:
- LIF Survey with UOVOST® Provides More Accurate Representation of LNAPL Plume at a Former Bulk Petroleum Storage Facility in New Hampshire
- UVOST Differentiates LNAPL Types to Allocate Financial Liabilities at a Retail Petroleum Facility in Tennessee
- TarGOST Determines DNAPL Extent and HPT Confirms Site Lithology at a Former Creosote Facility in Louisiana
Click here to download the entire document.

