
9.13 Resistivity, Seismic Exploration, and GPR Provide Data to Evaluate Clay Reserves at a Commercially Mined Pit
| Lisandro Suarez CT Department of Energy and Environmental Protection (DEEP) Hartford, CT [email protected] |
The purpose of this case study was to evaluate the clay reserves at a commercially mined clay pit. Geophysical techniques including GPR, ERT, and seismic exploration were used to help characterize a shallow stratigraphy. For clay mining purposes, the main objectives of performing these tests were to proof a clay deposit (with the intention of planning extraction operations). GPR techniques were not good to use on materials that exhibit low ER, such as clays. Nevertheless, GPR provided an estimate of the thickness of the top sand layer and an approximate depth to perched groundwater or depth to water table. In contrast to GPR, ERT was used particularly on materials that exhibit low resistivity. Resistivity-supplied information related to the clay-layer thickness and its heterogeneity. Seismic exploration was used to provide a better estimate of the thickness of the clay layer and the depth to bedrock.
Prior to the geophysical survey, a review of the U.S. Geological Survey bedrock geological map for the project quadrant was performed to help in understanding the local stratigraphy and soil characteristics.
Figure 9‑47 is an aerial photo that shows where the geophysical surveys were performed. Line 1 (150 m) was the west-east line profile where DC-resistivity and seismic exploration were performed. Line 2 (150 m) was the south-north line profile for DC-resistivity and seismic exploration surveys. The GPR profile was performed along the arrow marked as GPR.
Figure 9‑48 contains the Dipole-Dipole method (top image) and Schlumberger method (bottom image) resistivity test result for line 2. The north-south profile (line 2) in Figure 9‑48 was adjusted for topography by using Global Positioning System (GPS) technology. In general, all three profiles showed a clay layer with resistivity values between 10 and 150 Wm. The clay was fairly homogeneous throughout the first 20 m to 30 m below the sand layer. Perched groundwater or saturated sand and clay were found at the contact between the two distinct permeability layers (sand overlying clay) as indicated by the high resistivity values found toward the south end of the profile. In the instance when the underlying soil became saturated, the perched groundwater elevation became, by definition, the water table elevation. The survey profile for line 1 was similar to line 2 and indicated that the clay layer was relatively homogeneous.
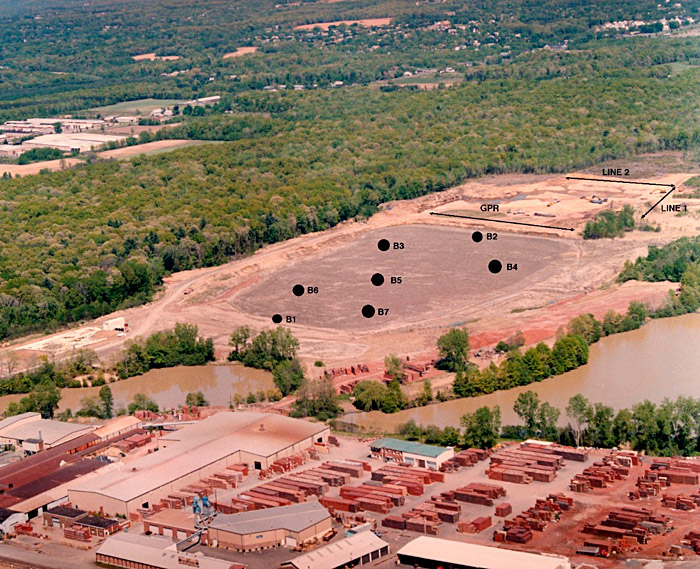
Figure 9‑47. Aerial photo showing the approximate location where the geophysical surveys were performed.
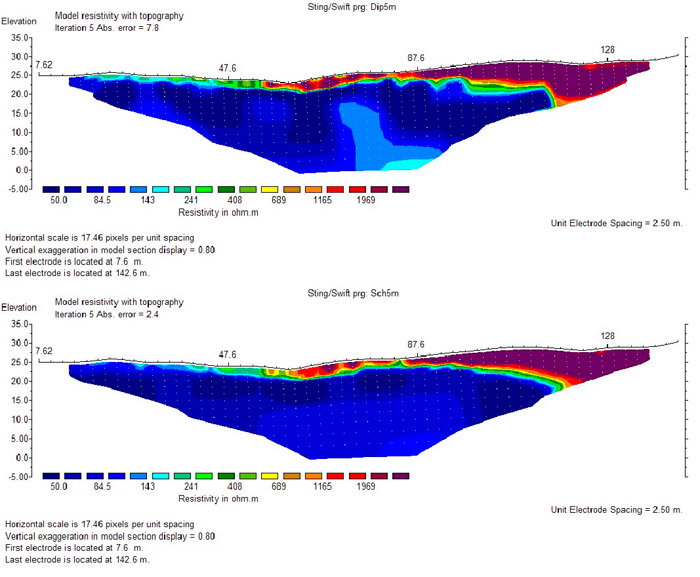
Figure 9‑48. The the inverse model for line 2 (north to south, from left to right of the profiles above) in which the true resistivity values of the subsurface tested were represented. (All distances in meters).
The goal of the seismic survey was to determine the approximate depth-to-bedrock. The data obtained to construct the site’s depth-to-bedrock profiles were mined by using refraction and reflection. Basically, three soil layers were found: A thin sand layer, a thick clay layer, and bedrock. Figure 9‑49 shows the north-south lithostratigraphy and depth-to-bedrock graph based on refraction and reflection techniques (north to south). The sand layer was delineated in pink. The west-wast lithostratigraphy was similar and showed bedrock at approximately 30 m of depth.
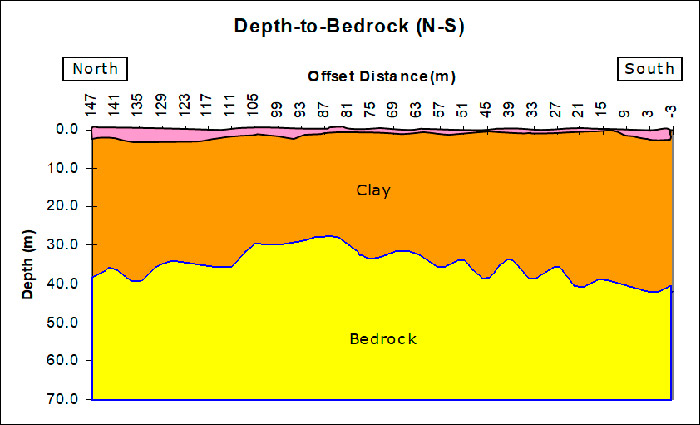
Figure 9‑49. North-South lithostratigraphy and depth-to-bedrock graph based on refraction and reflection techniques (north to south).
The purpose of the GPR survey was to delineate the sand layer from the clay layer with the intention of evaluating the volumetric tonnage of sand necessary to be stripped off before the clay layer could be properly mined. The resultant information was also used to plan and calculate the equipment necessary in the process as well as labor hours and other logistical issues.
The GPR survey (see Figure 9‑50) showed a layer of sand of about 2 m thick present on the north side of the site; it gradually decreased its thickness at a rate of about 2 cm/m toward the south. At about 100 m from the benchmark, the thickness of the sand layer was just a few inches. A clay layer was under the sand and the GPR could not penetrate it. It was expected that groundwater flowed at the interface between the sand and the saturated clay layers. No surface topography adjustment was made as the surface had relatively minor changes in elevation (zero-slope, man-made dirt road).
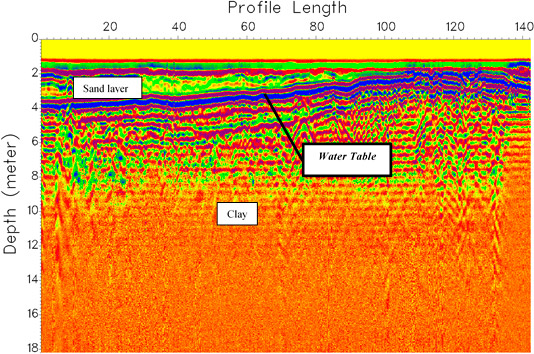
Figure 9‑50. GPR test result. The profile run from the north end of the proposed area (left corner, at 0 m) to the south end (right corner, at 140 m).
This combination of geophysical methods was performed to support decisions made by the management of a brick manufacturing company. Because bricks are made primarily out of clay, brick manufacturing companies are continuously monitoring their clay reserves and the clay properties that affect quality. Test results obtained on this project provided sufficient evidence that the clay was of great quality and there was plenty of volume to continue manufacturing bricks for many years to come.
The cost associated with this project was less than $100; in-kind services were provided by the University of Conneticut and the USGS.
Click here to download the entire document.

