9.16 Airborne Time-Domain Electromagnetic Method Maps Sand Distribution along the Illinois Lake Michigan Shore
| Kisa E. Mwakanyamale IL State Geological Survey Prairie Research Institute Univ. of IL at Urbana-Champaign Champaign, IL [email protected] |
Steven E. Brown IL State Geological Survey Prairie Research Institute Univ. of IL at Urbana-Champaign Champaign, IL |
Andrew C. Anderson IL State Geological Survey Prairie Research Institute Univ. of IL at Urbana-Champaign Champaign, IL |
Ethan J. Theuerkauf IL State Geological Survey Prairie Research Institute Univ. of IL at Urbana-Champaign Champaign, IL |
From Kenosha, Wisconsin to Chicago, Illinois the Lake Michigan coastline is a dynamic system of land uses and habitats where lasting benefits start with scientific understanding of how it all works together. Sediment distribution along this shoreline is constantly changing in response to increased human activities and complex natural coastal processes associated with wave action, short- and long-term fluctuations in lake level, and the influence of coastal ice. Beach sand is a critical coastal resource that helps alleviate beach and bluff erosion, often endangering sensitive ecosystems and habitats. Most sand along the Illinois Lake Michigan coast is transported from north to south as a result of the dominant waves approaching the shoreline from the north and northwest. Sand is also diverted and trapped by harbors and lake-fills along the Illinois shore, depleting the supply of littoral sand for longshore drift, also resulting in significant dredging costs, and impacts on recreational and commercial boating. The Illinois Coastal Management Program (ICMP) at the Illinois Department of Natural Resources is prioritizing sand management to protect the natural and cultural resources along this important shoreline.
This project complements efforts of the ICMP and the Illinois State Geological Survey (ISGS) to improve regional sand management along the Illinois Lake Michigan shoreline by mapping the thickness of nearshore sand. Developing a regional coastal information system is one of the main components of the long-term sand management plan. This project is focused on filling the information gap on sediment distribution in coastal waters off the Illinois coast. Understanding the characteristics and dynamics of nearshore sediment distribution is critical in unraveling patterns and processes of coastal erosion and accretion. To inform a regional sand management strategy, high-resolution, helicopter-transient electromagnetic (HTEM) data were collected along the southwestern Lake Michigan coast, surveyed about 73 miles from Kenosha, Wisconsin to Chicago, Illinois and about 0.6382 miles lakeward (see Figure 9‑56). New developments in airborne time-domain electromagnetic method in terms of instrumentation, data processing, modeling, interpretation algorithms, and measurement techniques coupled with the ability to measure large areas during short time periods make HTEM a cost-effective method for providing regional coverage. The HTEM method was used in this study to improve the quality of data and ground coverage of the entire shoreline.
The main project objectives are to 1) map the distribution of unconsolidated sand along the entire 73-mile stretch of the southwestern Lake Michigan coast and 2) demonstrate the value of collecting high-density HTEM data to improve the resolution and reliability of lithological mapping, and 3) show its applicability to long-term monitoring. The intended results from this project are maps and cross sections showing the extent and thickness of sand deposits, both around structures as well as further lakeward, and the extent of erosion and lake-bottom down-cutting. Understanding sand, the degree of erosion, and extent of down-cutting will facilitate decision making regarding the protection and improvement of critical coastal infrastructure. Identifying sand sources will aid in developing a regional sand redistribution model, possibly allowing the comparison of economies and efficiencies of various beach nourishment methods.
9.16.1 Survey and the Study Site
The Lake Michigan bottom is underlain primarily by sandy glacial deposits, and the bedrock under the glacial deposits is dolomite. Lake-bottom sand is distributed over the clayey glacial deposits, but areas along the south of the Illinois shoreline have dolomite near or at the land or lake-bottom. Using a dual-moment HTEM system allows both deep and shallow deposits of sand and clayey till to be targeted, with the possibility of mapping the bedrock topography. A line spacing of 100 m (328 ft) was used to provide high-lateral resolution of the thin sand layer overlying the clayey glacial sediment.
The HTEM survey covered nine approximately 117-km (about 73-mile)-long traverse lines running north-south along the coastline approximately 100 m (328 ft) apart (see Figure 9‑56), with several perpendicular lines of variable lengths where possible (areas with little to no cultural features). The total line km flown was 1,049 km (652 miles). The survey outline is presented in Figure 9‑38 with lines stretching from Kenosha in the north of the study area to south of Chicago.
The Illinois Lake Michigan coast is highly urbanized, resulting in challenges during data collection and causing noise in the acquired data. The presence of cultural features close to the lake (for example, buildings, boats, roads, and power lines) pose safety risks and are a source of noise to the HTEM data, causing survey (flight) lines to be diverted lakeward to the safe distance (see Figure 9‑56). The safe distance is counted as the distance between any point on the transmitter-receiver setup and the man-made conductor. The safe distance to any man-made conductor is at least 100 m over an earth with an overall resistivity of 40 Ωm-m to 60 Ωm-m (Ωm).
Weather conditions were another challenge. The Lake Michigan coast is consistently windy throughout the year. Strong winds and heavy clouds delayed data acquisition efforts over several time intervals during the study.
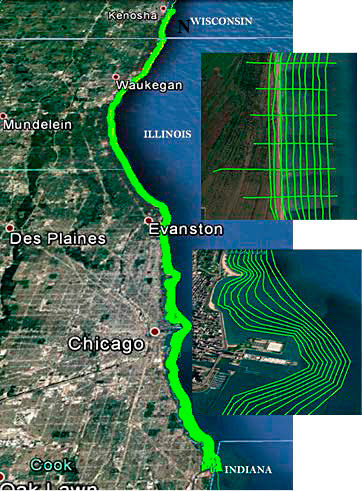
Figure 9‑56. Map showing the helicopter survey lines (green) at 100 m spacing, on the southwestern Lake Michigan shore. The top inset show example of perpendicular flight lines east of Illinois Beach State Park (IBSP). The bottom inset show the flight lines ~100 m away from infrastructures and buildings in Chicago.
Source: (Mwakanyamale et al. 2018)
9.16.2 Outcome
All HTEM data was processed (noise removal) and inverted using Aarhus Workbench software. Then, all filtered data were modeled using spatially constrained inversion (SCI). In this SCI algorithm, a group of time-domain EM soundings are inverted simultaneously using one-dimensional models. Each sounding yields a separate layered model, and then the models are constrained laterally. The result of the SCI inversion is a model section that varies smoothly along and across the profiles and yields a resistivity model that combines high-resolution shallow and deep subsurface information.
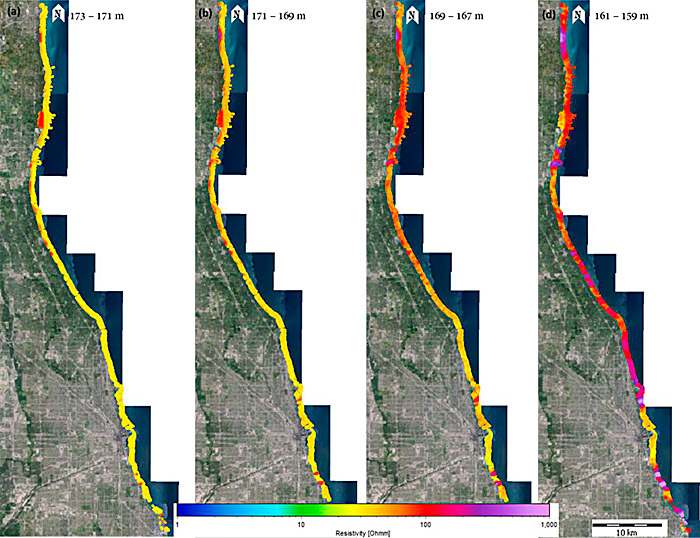
Layered models (resistivity) resulting from the inversion of collected HTEM data are presented as maps of mean resistivity in depth intervals and as layered 2-D resistivity profiles. Resistivity is shown on a logarithmic scale, the conductive (blue color) and resistive (purple color) features appear with the same weight. The white shading at the bottom of the 2-D profiles indicates the estimated lower depth of investigation. The maps in Figure 9‑57 show the distribution of resistivity for each layer in a model. The elevation slices were extracted from the interpolated 1-D resistivity models from collected HTEM data. The depth interval at 2 m (6.6 ft) for each layer is stated on the maps as elevation above sea level (see Figure 9‑57).
Figure 9‑57. Map showing distribution of resistivity in Ωm. The maps represent change in resistivity with depth, from the elevation of 173 m – 159 m (568 ft – 522 ft) at 2 m (6.6 ft) intervals. The variation in resistivity is due to difference in electrical conductivity properties within various geological units (lake water – bedrock).
Source: (Mwakanyamale et al. 2018)
Resistivities were modeled between 173 m (568 ft) to 159 m (533 ft) elevation (see Figure 9‑57 (a-d), respectively), As expected, resistivity significantly changes with depth. Low resistivities (less than 50 Ω m) predominate the water column and some shallow sediment (not visible in the map), but layers of much higher resistivity material (greater than 500 Ω m) are observed in the deeper layers (bedrock). At shallow depths, 171 m – 167 m (561 ft to 545 ft) (see Figure 9‑57 (b) and (c)) the north side of the map is dominated by resistivities of about 100 Ω m. Zones of high resistivity material are present at the south end of the site at both 171 m to 169 m (561 ft to 554 ft) and 169 m to 161 m (554 ft to 528 ft) elevation.
Figure 9‑58 shows a map of filtered HTEM soundings (white dots) used in modeling of resistivity data, overlaid by selected 2-D resistivity profiles (resistivity distribution with depth) (see Figure 9‑59 and Figure 9‑60).
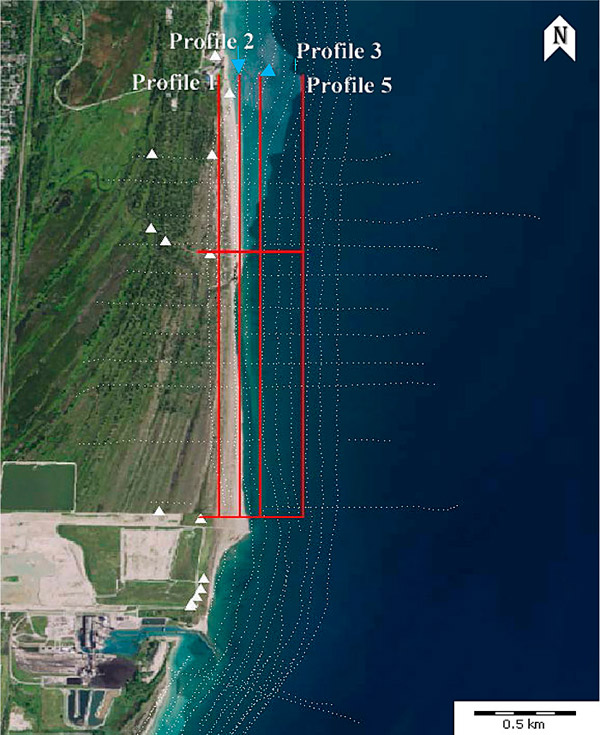
Figure 9‑58. Map showing filtered HTEM soundings (white dots) and selected profiles (red lines) to present 2-D resistivity distribution below. White triangles are borehole locations close to HTEM lines.
Source: Modified from (Mwakanyamale et al. 2018)
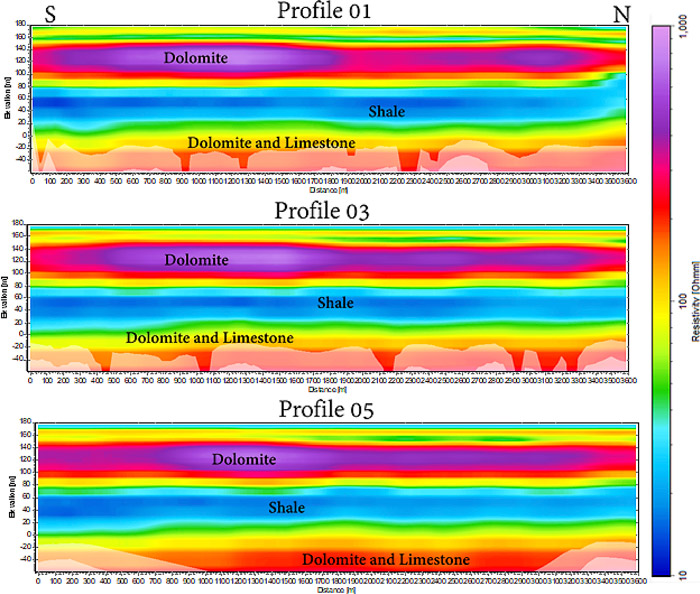
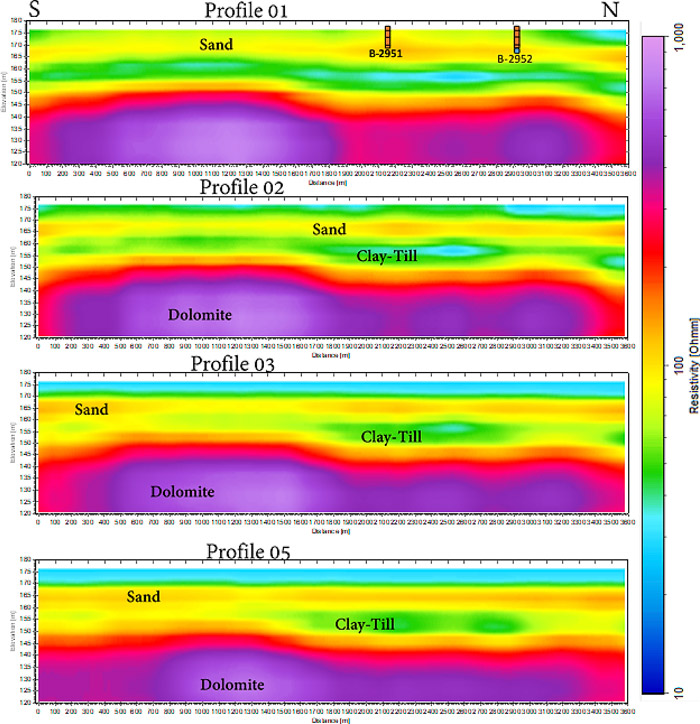
The 2-D inversions of the HTEM data resulted in a six-layer framework (including the water column) across the profiles. The observed sharp contrast in resistivity from the lake water to the bedrock material is due to changes in electrical conductivity properties within the different units of the framework. This observed variability in resistivity values across the layers (see Figure 9‑59 and Figure 9‑60) is consistent, for example, with changes in grain size and rock material between shallow <150 m (492 ft) elevation (unconsolidated glacial sediment (for example, sand, silt and clay) and deeper >140 m (459 ft) elevation (bedrock material, for example, dolomite, shale and limestone) layers. These observations are confirmed by shallow borehole information along the shoreline. Boreholes that penetrate fully through the sand and clay glacial deposits are absent, but the low resistivity layer was interpreted as clay-till. Boreholes 2951 and 2952 encountered a sand layer of about 8.8 m (29 ft) thick with clay at the bottom of borehole 2952 (see Figure 9‑60). As shown above, the hot colors (purple) indicate resistive features (for example, dolomite, Figure 9‑59 and Figure 9‑60), while the cooler colors (blue) indicate conductive features (for example, shale, Figure 9‑59 and clay Figure 9‑60, respectively).
Thin layers beneath the water column are shown on the expanded depth axis in Figure 9‑60 (y-axis). The yellow to brown color (between 80 Ω m to 120 Ω m) is interpreted as sand (see Figure 9‑59). Depending on the grain size and level of water saturation (for example, sand at the beach) a different resistivity value will show compared to the sand on the lake bottom. This is also confirmed by the borehole 2951 and 2952 in Profile 1.
The water column is clearly seen in Profiles 2, 3 and 5 (see Figure 9‑59 and Figure 9‑60) as an approximate30 Ω m layer (resistivity value was recorded using a conductivity meter).
Figure 9‑59. Electrical resistivity results from 2-D modeling of the airborne electromagnetic. There is a sharp contrast in resistivity values with depth indicative of difference in electrical conductivity within geological units.
Source: Modified from (Mwakanyamale et al. 2018)
Figure 9‑60. Electrical resistivity results from 2-D modeling of the airborne electromagnetic data at the IBSP in Zion, IL. The thin clay and sand layer is clearly seen in these cross sections. The cylinders in Profile 1 are borehole number 2951 and 2952 showing presence of sand layer (brown) of about 8.8 m (29 ft) for both boreholes, with clay (blue) at the bottom of borehole 2952.
Source: Modified from (Mwakanyamale et al. 2018)
The overall distribution of the sand body along the shoreline from Kenosha to south Chicago is shown in Figure 9‑61. This 3-D view of the resistivity data shows a trend in sand thickness that has been reported consistently (for example, (Fraser and Hester 1974); (Shabica and Pranschke 1994). As expected, the models indicate a thick layer of sand (yellow layer) on the northern section of the shoreline (north of Great Lakes Naval Station), albeit with some patches of thin sand, silt/clay (green layer), or exposed bedrock (red/ purple) in some locations. This portion of the shoreline, which is adjacent to the lake, allows the largest (≥10 m (+33 ft)) littoral sand deposit observed in the entire shoreline. South of the Great Lakes Naval Station and north of Winthrop Harbor to Kenosha, sand deposits are relatively thin, and the bedrock is exposed in most areas. A thin coating of silt/clay is present on north and south of W. Foster Ave and Winnetka and absent south of the city of Chicago and around Kenosha, exposing the dolomite bedrock (red or purple color).
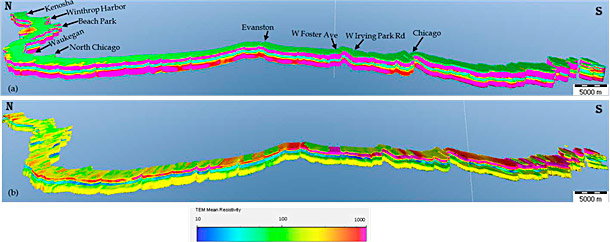
Figure 9‑61. D view of the resistivity results along the SW Lake Michigan shoreline. (a) 3D view of all the interpreted geological layers, with the water column shown as pale green; (b) the water column is removed to expose the units on the lake bottom.
Source: Modified from (Mwakanyamale et al. 2018)
9.16.3 Summary
HTEM results from the airborne survey provide insights into the variability in distribution and thickness of unconsolidated sand along the southwest Lake Michigan shoreline. This study aimed to provide both qualitative and quantitative information on sand thickness, sand distribution, and bathymetry along the 73-mile (117 km)-long shoreline from Kenosha, Wisconsin to the Illinois state line south of Chicago. The resistivity images provide unique continuous information on the spatial variation in distribution and thickness of the unconsolidated sediment on the nearshore. Here, the resistivity of unconsolidated sand and gravel is assumed to be in the range of 90 Ω m to 200 Ω m (Culley, Jagodits, and Middleton 1976); (Telford et al. 1976). The resistivity of lake water was measured during the waterborne ERT survey with a conductivity meter reading of 30 Ω m. The 2-D modeling of the resistivity data confirms that a major portion of the Illinois nearshore is comprised of a thin layer of unconsolidated sand with numerous bedrock outcrops.
The resistivity results are consistent with available borehole information on the thickness of the sand layer, especially in the IBSP area. The borehole records date from 20 years to 40 years ago. Littoral sand thicknesses may have changed significantly since that time, so the correlations are considered tentative. Most boreholes close to the shore were only drilled to penetrate the sand layer; few have information on the bedrock material. As a result, much of the available borehole data is too shallow to be used in interpretation of the resistivity data. Layers of clay, silt, dolomite, and shale were encountered in a few boreholes which penetrated bedrock. Due to the dynamic nature of the nearshore sand, only boreholes close (about 50 m (164 ft)) to HTEM lines were used to interpret resistivity data. Due to littoral transport, abrupt changes in thickness of unconsolidated sediment are possible within a short distance; hence, comparison between borehole information and resistivity data that are not in close proximity to one another can be misleading. Further efforts to obtain cores to verify thicknesses of surficial sand and geologic units in the subsurface are planned, including hydraulic probing surveys to directly compare the mapping (Fraser and Hester 1974); (Shabica and Pranschke 1994).
Click here to download the entire document.

