3.2 Membrane Interface Probe
A MIP is an ASCT that is deployed using a direct-push or CPT platform. The tool consists of a probe fitted with a small gas permeable membrane connected to flowing stream of inert carrier gas that is directed uphole to one or more detectors (for example, a PID). The probe also contains a block heater and a small EC array. The MIP can detect VOCs and some semi-volatile organic compounds (SVOCs) in the subsurface and generates real-time logs of detector response (Christy 1996); (ASTM 2017). MIP is typically used to assess relative concentrations of hydrocarbons or solvents in the subsurface and the depth of their occurrence. The MIP can assist the user in overcoming the challenges associated with fully understanding contaminant distribution in heterogeneous unconsolidated or semiconsolidated materials. The MIP is rarely used as a standalone tool and instead is combined with other direct sensing tools (for example, HPT and EC) that allow for a more thorough understanding of subsurface contaminant distribution and potential migration pathways. In the interest of simplicity, this section primarily focuses on the MIP tool. Additional tools commonly used in tandem with the MIP are discussed in subsequent sections.
The primary uses of the MIP are as follows:
- a timely and cost-effective method for detecting VOCs (combined sorbed, vapor phase, and dissolved) in saturated and unsaturated zones by recording qualitative to semiquantitative levels of total VOCs in situ with depth
- real-time data collection for dynamic work plan implementation
The primary benefits of the MIP are as follows:
- optimizes site assessment and remedial efforts by providing a rapid, high-resolution depiction of contaminant distribution in the subsurface to identify discrete targets (for example, hot spots) for more effective sampling, monitoring well screen placement, and remediation
- with some limitations, infers the presence of light nonaqueous phase liquid (LNAPL) and dense nonaqueous phase liquid (DNAPL)
- obtains information about local geologic conditions when combined, as is typically the case, with other direct-push sensors (EC, HPT, CPT)
- supports collaborative data visualization and analysis and decision making via logs that can be transmitted with secure, cloud-based, real-time data management systems and presented with two-dimensional (2-D) and three-dimensional (3-D) mapping tools
- distinguishes between different classes of VOCs (for example, halogenated versus nonhalogenated compounds) when used with multiple detectors
- presents significantly less potential for worker exposure to impacted media versus conventional sampling methods
The MIP can significantly reduce the amount of data gaps in the CSM because it provides a detailed set of data along the depth of the borehole (typically at 1-ft intervals), rather than at the coarser intervals typically associated with conventional soil sampling methods. MIP data can be used to create one-dimensional (1-D) profiles, 2-D transects, and 3-D interpolated visualizations and interactive maps. Each method of presentation can help refine the CSM and develop a remedial approach, leading to a clearer understanding of the site also that all stakeholders can support a common path forward.
3.2.1 Tool Description
The MIP was developed by Geoprobe Systems® as a logging tool to detect the presence of VOCs in situ (Christy 1996).
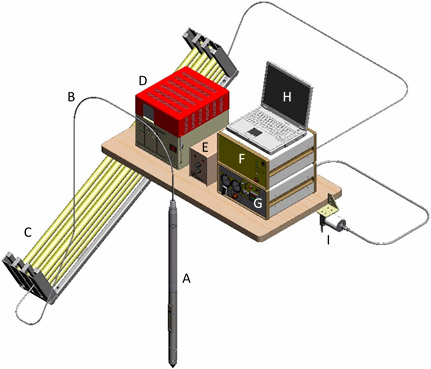
Figure 3‑1. Components of a typical MIP system.
Source: Geoprobe Systems®, Used with permission
The MIP system consists of A) the MIP probe, B) prestrung trunk line within the probe, C) probe rods organized in rack, D) GC with gas-phase detectors, E) detector controller, F) field instrument that converts analog signal to digital data, G) MIP control, H) laptop computer, and I) string potentiometer that measures depth of probe advancement (see Figure 3‑1).
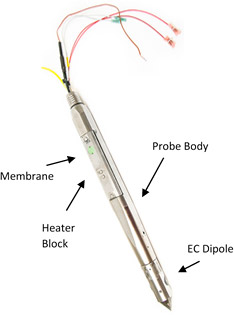
Figure 3‑2. The MIP probe.
Source: Geoprobe Systems®, Used with permission
The MIP is a 24-inch (60-centimeter (cm))-long steel probe with a maximum diameter of approximately 2 inches (50 millimeters (mm)) (see Figure 3‑2). A semipermeable membrane about ½ inch (12 mm) in diameter is located on the side of the probe. The membrane is reinforced with stainless-steel mesh, allowing advancement into soil and unconsolidated (and some poorly consolidated) formations with direct-push methods. A polymer clad trunk line is prestrung through the drive rods and connects the downhole probe and sensors to the uphole instrumentation (see Figure 3‑1).
MIP operation is straightforward. VOCs in the formation cross the semipermeable membrane and enter the carrier gas flow to be swept up the trunk line to gas-phase detectors at the surface (see Figure 3‑3) (Christy 1996). Volatilization of subsurface contaminants is enhanced by heating the soil, groundwater, and vapor in the soil pore space adjacent to the membrane with a heater block. The MIP log viewing software allows the detector response to be logged versus depth in real-time.
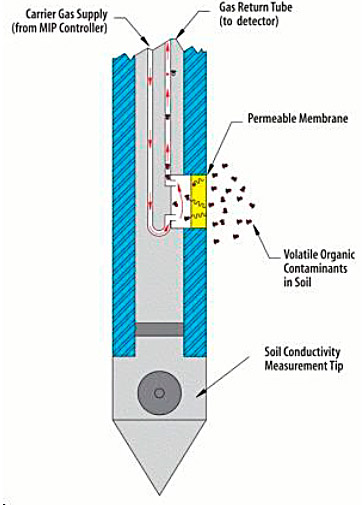
Figure 3‑3. MIP principles of operation.
Source: Geoprobe Systems®, Used with permission
The MIP is nominally advanced in 1-ft increments, stopping at each increment to heat the soil, water, and vapor for a consistent period to ensure the surrounding VOCs in the subsurface are volatilized and, therefore, screened consistently. VOC data are collected every 0.05 ft, but the most representative VOC measurements are collected at the 1-ft increments in which the MIP stops. Tandem EC and HPT sensors provide lithologic data every 0.05 ft (about 15 mm) as the probe is advanced. Site lithologic characteristics dictate how fast the probe can be advanced and the refusal penetration depth. The type of contaminant and its associated boiling point and vapor pressure dictate the length of the heating cycle at each depth, typically 45 to 60 seconds (sec). These parameters should be established in the field by conducting performance testing and determining the time required for contaminant(s) of conern to travel across the MIP membrane prior to deployment (Geoprobe 2015b); (ASTM 2017).
Total VOCs are detected using a PID, FID, and a halogen-specific detector (XSD). An EC probe located on the probe also measures the EC of the soil adjacent to the probe. Graphic logs of VOC detector responses are recorded as the MIP is advanced with depth. The PID responds to VOC molecules with an ionization potential below 10.6 electron volt (eV), which includes aromatic hydrocarbons and molecules with carbon double bonds [tetrachloroethene (PCE); trichloroethylene (TCE); and benzene, toluene, ethylbenzene, and xylenes (BTEX)]. The FID generally responds to VOC molecules with a carbon-hydrogen bond, which includes most VOCs that combust in the H2-air flame. The XSD responds only to halogenated (fluorine, chlorine, bromine) VOCs and has largely replaced the older electron capture detector (ECD) for detecting these compounds.
Figure 3‑4 shows a MIP log of gasoline contamination in an alluvial aquifer setting. The left panel is the log of bulk formation EC. Higher EC readings in the upper 30 ft of the log indicate clay-dominated materials; below 30 ft, decreased EC indicates the presence of sandy materials with some silt-clay lenses. Panels 2 and 3 are the PID and FID detector responses, respectively. Baseline readings down to about 23 ft indicate no response above background. Elevated PID and FID detector responses between 23 ft and 35 ft indicate that significant hydrocarbons are present. The baseline reading on the XSD indicates that no detectable chlorinated solvents are present at this location.
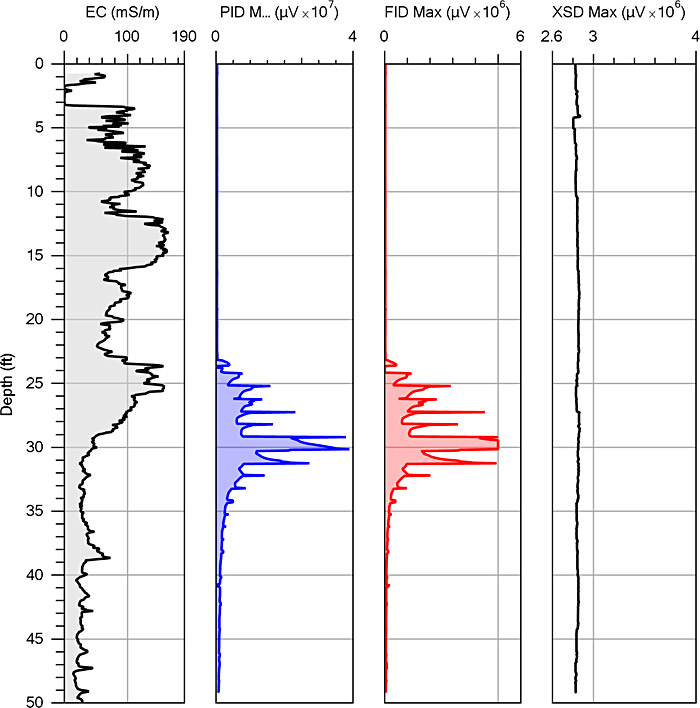 Figure 3‑4. A MIP log of gasoline contamination in an alluvial aquifer setting.
Source: Geoprobe Systems®, Used with permission
3.2.2 Technical Limitations
The MIP system provides qualitative to semiquantitative results for total VOC levels (combination of sorbed, vapor, and dissolved VOCs) in the bulk formation. Because a chromatography column is not used to separate analytes in the sample gas stream before their introduction to the gas-phase detectors, specific analyte identification is not possible. Using multiple detectors that are sensitive to different groups of contaminants (for example, aromatic hydrocarbons, chlorinated VOCs) helps to identify the type of contaminant(s) present. In some modified systems, the MIP gas stream can be sampled for further analysis with additional assay methods (for example, GC/MS) (Costanza and Davis 2000); (Van de Putte et al. 2012); (Considine and Robbat 2008). The MIP should not replace traditional soil sampling and monitoring wells but is a means to optimize a reduced number of boreholes and monitoring wells to achieve site characterization and long-term monitoring objectives.
In recent years, there has been significant interest in defining the presence and extent of NAPL in the subsurface. The MIP can be used to infer the presence of subsurface concentrations consistent with the presence of fuel NAPL (residual or saturated); however, the Ultraviolet Optical Screening Tool® (UVOST®) (see Section 3.4.1.1) or OIP-Ultraviolet (OIP-UV) (see Section 3.3) logging methods are more accurate and efficient for this task. When NAPL is encountered during MIP operation, the membrane, carrier gas tubing, and detector may become overloaded. This overload can produce artificially high background readings as the MIP is advanced past the NAPL zone. Once the lines and detectors are oversaturated, purging the lines and system can take some time and may require pulling the tool out of the ground.
3.2.2.1 Detection Limits
MIP detection limits depend on many factors, including, but not limited to, the analyte characteristics (boiling point, volatility, solubility), soil type, temperature at the membrane face, and detector used. Table 3‑1 provides estimated lower limits of detection in bulk formation for several contaminant classes for common detectors.
Table 3‑1. A guide to analyte detection levels in bulk formation using the MIP system and typical detectors
Source: Geoprobe Systems®, Used with permission
| Detector | Analyte detection limits [parts per million (ppm)] | ||||||||
|---|---|---|---|---|---|---|---|---|---|
| BTEX | Gasoline | Diesel | TCE, PCE | CCl4 | DCE | VC | DCA, TCA | CH4 | |
| PID* | 0.5 – 5 | 3 – 10+ | 10 – >25 | 0.5 – 3 | N/A | 5 – 10 | >5 | N/A | N/A |
| FID† | 1 – 10 | 1 – 5 | 3 – 10 | >500 | >500 | 25 – 50+ | >50 | 10 – 25 | 100 (ppm-v) |
| XSD‡ | N/A | N/A | N/A | 0.2 – 0.5 | 0.2 – 0.5 | 0.2 – 0.5 | 0.2 – 0.5 | 0.2 – 0.5 | N/A |
| ECD§ | N/A | N/A | N/A | 0.2 – 0.5 | 0.1 – 0.5 | 25 – 50 | >100 | 1 – 25 | N/A |
| *PID – photoionization detector; †FID – flame ionization detector; ‡XSD – halogen-specific detector; §ECD – electron capture detector | |||||||||
| BTEX – benzene, toluene, ethylbenzene, and xylenes; CCl4— carbon tetrachloride; DCE — dichloroethylene; VC — vinyl chloride; DCA — dichloroethane; TCA – trichloroethane, ppm: parts per million CH4: methane, ppm-v: parts per million by volume in air NA: not applicable, this detector not sensitive to this analyte. |
|||||||||
The MIP and associated detectors are generally appropriate for investigating common VOCs, including chlorinated solvents, light oil and fuel mixtures, and those VOCs that are not fully miscible in water and have low-to-moderate boiling points (see Table 3‑1). Multiple detectors are available for analyzing the effluent gas, including the PID, FID, XSD, and ECD. If a detector option is available, then the detector, or more likely, combination of detectors should be selected based on the properties of the compounds being investigated (Table 3‑2). It is worth noting that the FID detects all hydrocarbon VOCs, including methane, which is common when anaerobic degradation is occurring. The other two detectors (PID, XSD) do not detect methane. If a response is present on the FID and not on the PID or XSD, then methane is likely present.
Table 3‑2. Inferring analyte category based on response(s) of MIP multidetector system
Source: Modified from Geoprobe Systems®, Used with permission
| MIP Detector | Chlorinated or fluorinated ethenes | Chlorinated alkanes | Gasoline, diesel, or similar petroleum fuel | BTEX, Naphthalene | Methane | Mixed petroleum fuel or BTEX and halogenated VOCs |
|---|---|---|---|---|---|---|
| Relative detector response(s) to analyte categories | ||||||
| PID | Moderate to High | None to Low | Moderate to High | High | NA | Moderate to High |
| FID | Low (See notes below) | Low | High | High | High | Moderate to High |
| ECD | Low to High | High | NA | NA | NA | Low to High |
| XSD | Moderate to High | High | NA | NA | NA | Moderate to High |
| Notes | FID often Responds in Chlorinated DNAPL | Detection of chlorinated alkenes on PID can differentiate chlorinated alkanes which don’t respond on PID | Relative PID- FID response Will Vary with degree of weathering | Other non-chlorinated VOCs may give similar response pattern | Useful for tracking landfill gas plumes, releases of natural gas or for monitoring methane produced by anaerobic insitu bio projects | |
Soil type, saturation level, and proximity of contaminants to the surface of the probe can significantly affect the ability of the MIP to detect subsurface contamination. Different soil types and variations in degree of saturation can influence the ability of the MIP probe to volatize compounds and may result in variability in detection levels that are unrelated to the mass concentrations present. The MIP volatilizes chemicals in media that are in direct contact with its heated membrane and not from media located further out into the surrounding formation. If contaminant distribution is highly heterogeneous, as is often the case, the MIP may fail to detect contaminants that are too distant from the probe.
Low-level MIP systems can be used when lower detection limits (for example, below the ppm level) are required such as when halogenated VOCs are the contaminant. A low-level MIP system includes an additional carrier gas flow modulating controller to start and stop the carrier gas flow at desired times and depths. Using the low-level system increases the detection level of the MIP system by approximately an order of magnitude for many contaminants.
3.2.2.2 Interferences
In zones with high concentrations, carryover or cross contamination of the membrane sampling port and return carrier gas line may occur as the MIP is advanced. Carryover or cross contamination results in slow bleed off of signal response for an extended depth below the interval where the high concentrations were encountered. At lower concentrations, complex mixtures (for example, gasoline) containing lower volatility and higher molecular weight compounds travel through the gas line at a slower rate, arriving at the detector(s) sometime after the more volatile contaminants, resulting in a delayed or shifted response. These effects can result in detector responses being plotted at greater depth than where the analytes were located in the formation. This carryover effect (Bumberger et al. 2011); (Adamson et al. 2014); (McCall et al. 2014) often has been mischaracterized as a physical drag down of contaminants. Actual physical drag down of contaminants while logging appears to be much less common than carryover effects.
As the MIP provides for total VOC detection without analyte separation and specificity, interference between analytes is common. Interference can be most pronounced on sites where both chlorinated VOCs like TCE and PCE are present as well as BTEX compounds. TCE, PCE, and BTEX compounds cause a response on the PID detector (see Table 3‑2). Thus, it is necessary to look also at the XSD where only chlorinated compounds cause a response and the FID where only BTEX causes a response. Using multiple detectors helps identify classes of contaminants and reduce interferences.
Additionally, some natural and manmade compounds are nonhazardous but cause a detector response. Natural pine oil or similar natural aromatic compounds from pine tree or juniper roots may yield a response if touched by the MIP membrane at depth. Some potential nonhazardous manmade interferents may include isopropyl alcohol (rubbing alcohol) or windshield washer fluid (with alcohol) recently spilled at a targeted boring log location. If the MIP system is operated with a NafionTM dryer, then low concentrations of alcohol may be removed, but higher concentrations may be detected. The site should be investigated to assess the potential presence of nonhazardous VOCs and, if identified, these interferents should be included in the data interpretation, if they cannot be eliminated.
3.2.3 Data Collection Design
General information pertaining to data collection and design for direct sensing tools is provided in Section 3.1.5. Additional considerations to design effective MIP investigations are as follows:
- Select appropriate detectors and supporting technology.
- Determine verification requirements.
Selecting the appropriate complementary tools can help define contaminant migration pathways, geologic barriers, flux, and other parameters of interest. Appropriate detectors should be selected based on the contaminants at a site (see Table 3‑1). Although it is not necessary to use multiple detectors simultaneously at all sites, it is typical. Since the FID destroys the vapor sample being analyzed it is usually the last detector to receive the MIP carrier gas stream. Similarly, MIP are routinely used in tandem with other logging tools such as an EC array, HPT [or membrane interface HPT (MiHPT)], or CPT sensor. It is important to note that the CPT sensor can be used only on CPT-type direct-push rigs, not percussion-driven, direct-push rigs. Complementary tools should be selected based on known and anticipated hydrogeological properties of the site.
Because data produced by the MIP is qualitative to semiquantitative and susceptible to interference (see Section 3.2.2.2), it is important to supplement MIP data with quantitative data from confirmation samples collected and analyzed on site or in a lab. In general, laboratory confirmation samples should be collected from areas of high, low, and medium response to verify the ability to detect the target contaminants in all desired concentration ranges. Verification sampling should also consider the number and location of geologic layers, as detector response may be affected by subsurface geology. In addition, regulatory agencies may have specific requirements for verification sampling.
3.2.4 Quality Assurance and Quality Control (QA/QC)
Proper operator training in using the MIP system is critical to obtaining logs that represent subsurface conditions. Training includes proper operation of MIP system electronics, GC, and operating software, as well as understanding MIP advancement methods and component maintenance. Improper operation and lack of maintenance can result in poor-quality and even inaccurate data.
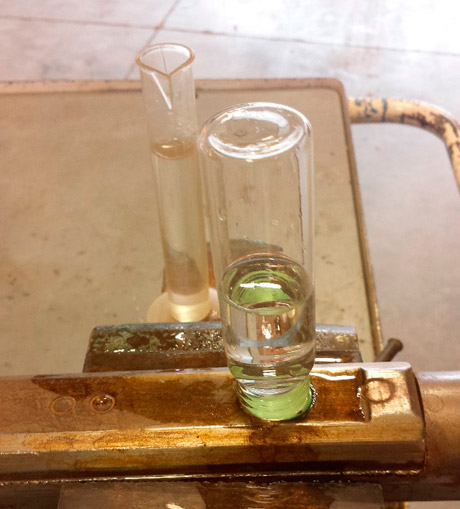
Chemical response testing is an important QA measure used to validate each log by demonstrating the integrity of the GC detectors and MIP system. A response test must be performed before and after each log. The response test standard should be made from one or more VOCs found at the site under investigation. A MIP reference test must be performed by preparing a working standard in a 40-milliliter (mL) volatile organic analyte (VOA) vial, inverting it over the membrane, and leaving it in place for 45 sec to 60 sec. A clean vial with deionized water may be used to run a blank test in the same fashion (see Figure 3‑5). For example, at a site where both gasoline and PCE were released, the stock standard may be made with benzene and PCE to verify performance of the MIP system and GC detectors for these analytes. Gas standards of much lighter VOCs (such as methane) can also be applied to the membrane.
Figure 3‑5. Response test – method of introducing an aqueous standard to the membrane.
Source: Geoprobe Systems®, Used with permission
In a laboratory setting, precision is usually assessed by comparing the results of duplicate analyses; however, because MIP samples are obtained in situ, it is not possible to collect true duplicate samples. Instead, an estimate of the instrumental precision can be obtained for the entire system by evaluating the results from multiple measurements of response test samples, which are analyzed before and after each push.
QC is performed during and after each log is generated. Log QC addresses the following concerns to ensure that the log data are valid (Geoprobe 2015b):
- Proper functioning of the MIP system. Does the log look correct? Does anything in the MIP log and detector responses make you suspect that the MIP system wasn’t working correctly (for example, sudden changes in pressure, flow or temperature that correspond with a shift in detector response)?
- Consistency between chemical response tests. As more logs are completed, do they show general consistency between chemical response tests?
- Significant changes seen in the response factor(s). As multiple logs are completed, a Response factor is defined as the amount of signal response divided by the signal response increase on a response test.Control charts of response test results over time can be used to gauge typical MIP system and detector response factor variations; however, response factors vary due to numerous variables, including the membrane condition and age, trunk-line type and length, and ambient temperatures.
- Log repeatability and system consistency. Review log overlays or a cross section of logs in the log viewing software to evaluate log repeatability and system consistency. Replicate logs may be run every 10 to 20 locations to verify repeatability. Run replicate logs with a 0.5-m to 1.5-m spacing (approximately 3-ft offset from original borehole) for optimum results. Small-scale variability is common; large-scale patterns are usually consistent.
- Comparison of sample results to log responses. Collect targeted soil cores or groundwater samples guided by MIP detector responses. Analyze the cores in an on-site mobile laboratory or send off site for rapid turnaround analysis. If possible, compare sample results to log responses as the field work proceeds so that adjustments or maintenance to the MIP system/GC detectors can be performed if needed.
3.2.5 Data Interpretation and Presentation
Since multiple sensors are typically used and readings are recorded at 0.05-ft intervals, investigations using MIP generates a significant quantity of data. If available, field notes recorded during an investigation using an MIP should include an interpretation of the sensor results for each log run. A more rigorous analysis should follow shortly after each day or mobilization and may include the generation of maps, cross sections, 3-D figures or animations, and other types of data displays. Data can be used to update the working CSM in the field to allow the CSM to evolve real-time in the field as additional data are generated. The final data presentation includes the interpreted MIP results as well as relevant CSM components (for example, source locations, geologic strata and properties, groundwater elevations and flow, mass flux). The following subsections provide summaries of the stages of data interpretation and presentation for an investigation using MIP.
3.2.5.1 Field Log Interpretation
As the investigation proceeds, the field team should view a graphical presentation of the sensor results on a computer monitor as the MIP is advanced. Depending on the sensors used, the field investigator may be able to determine, in real-time, the (1) relative level of impact at the boring location compared to other boring locations, (2) vertical distribution of impacts, (3) location of the groundwater table (see Section 3.2.6) and (4) vertical distribution of lithologic units. Step-out locations can be selected in the field based on this initial real-time data review.
It is possible to use the level of detector response or lack of response from the different detectors in the MIP system to tentatively identify the category of VOCs present. For example, when the XSD and PID give strong responses but the FID has a weak response, the analytes being detected are most likely chlorinated ethenes like PCE or TCE. More examples are provided in Table 3‑2. To confirm an analyte category or to identify a specific analyte, colocated samples of environmental media need to be collected and submitted for laboratory analysis.
While all logs are visible on a laptop screen as work progresses, printed or electronic logs are typically made available by the operator at the end of the log run, end of day or by the following morning. Overlays of two or more logs can be created for comparison and simple cross sections may be created using the field logs to evaluate site hydrogeology and potential contaminant migration pathways or contaminant storage zones. Such information can be useful when implementing adaptive sampling plans. Logs can be used in the field to help answer the following questions:
- Have all relevant geologic layers been investigated (that is, have the MIP borings penetrated to the bedrock or a sufficient distance below the impacted zone to confirm vertical extent)?
- Are additional borings required to complete horizontal and vertical delineation?
- Where should confirmatory soil and groundwater samples be collected?
These questions and other data objectives are established in the planning phase prior to mobilization.
3.2.5.2 Data Presentation
Deliverables from the operator at the end of the project should include a field report, digital copies of the log files for use in the Direct Image Viewer software, and text files of the raw sensor data. The required deliverables should be specified in the contract before field work is initiated.
The field report may vary from company to company, but should describe the sensors used, include response test procedures and final logs for each boring, provide a table of borings drilled and provide basic boring information such as boring ID, total depth, date and time, and a location map or coordinates. An experienced service provider should be able to provide a summary report that includes a QC review of all logs and describes issues associated with individual log runs. The consultant or site owner should request a copy of the raw or final edited logs files for recordkeeping purposes. Data from these logs can be reviewed for QA later. Scaling of the log graphs is an important consideration when comparing results from multiple locations as several factors other than concentration can influence peak responsess and sensor responses can span several orders of magnitude. Many providers will provide two sets of logs prints, one set with common sensor scaling for all the boring logs, and another set where each boring log is scaled individually to show the most detail for each sensor in that individual boring.
3.2.6 Tool and Data Misuses
Lithology, saturation, the presence of multiple compounds, and other factors make direct correlation of MIP response to compound concentrations problematic. Detection levels measured in volts may not correlate directly to concentrations. In some cases when compared with physical sample analyses, MIP results have poor quantitative correlation, especially if limited samples were collected (Quinnan 2010); (Adamson et al. 2014). MIP values may vary by orders of magnitude from one location to another and are not absolute or unique to a specific compound or concentration.
A lack of MIP response does not necessarily indicate that the soil column investigated is free of VOCs or SVOCs because MIP detection limits (Table 3‑1) are typically well above regulatory action levels. The MIP cannot, therefore, be used to directly determine whether health-based levels have been exceeded in a particular media.
3.2.7 Supporting and Enhancing Instruments and Technologies
Attempting to use the standard MIP configuration to characterize low-level or high-level contaminated sites can be challenging. In some cases, modified field procedures or slightly modified versions of the tool allow characterization at these sites. The low-level MIP system is used to detect lower VOC concentrations by pausing the return carrier gas to concentrate the VOC signal seen by the detectors by approximately an order of magnitude. Heated transfer line MIP (HTL-MIP) incorporates a heated trunk line to minimize trunk line analyte retention that occurs with high-level analyte concentrations or condensation in colder ambient conditions. Both methods require hardware modifications to the standard MIP.
The MIP is typically used in conjunction with other direct sensing tools to allow as much subsurface information to be gathered as possible during a single push. The MIP is equipped with a small dipole EC array (see Section 3.7 near the end of the probe to acquire a log of bulk formation EC as the probe is advanced. In many cases, the MIP is equipped with a HPT port (MiHPT) to conduct injection logging. Tandem HPT logging provides an injection flow and pressure log versus depth to help evaluate formation permeability (see Section 3.5). Used together, the EC and HPT logs can help better define stratigraphic and hydrostratigraphic characteristics of the subsurface. Plotting MIP detector logs with HPT and EC logs can help identify contaminant migration pathways or low permeability back-diffusion sources of VOCs. The MIP can also be advanced in tandem with a CPT cone (see Section 3.5) to obtain information on soil type and material strength. Targeted sampling of sedimentary layers is recommended to confirm MIP log data for VOC distribution and lithologic interpretation.
3.2.8 Case Studies
The following case studies describe specific implementation of MIP:
- MIP Boring Data Allow On-Site Decisions to Fill Data Gaps and Reduce Uncertainty during Triad Approach Evaluation at Five South Dakota Sites
- MIP Allows Real-Time Identification and Delineation of DNAPL Plume at a Former Naval Air Station in California
3.2.9 Additional Information
- Alaska Department of Environmental Conservation, Division of Spill Prevention and Response Contaminated Sites Program, Field Sampling Guide (ADEC 2017).
- Montana Light Non-Aqueous Phase Liquid (LNAPL) Recovery and Monitoring Guidance (MDEQ 2013).
- Senate Bill 96 (2015) Status of $7,000,000 Appropriation from the Orphan Share Account Environmental Quality Council – Final Report (MDEQ 2017).
- Final Proposed Plan, Former Kirksville Air Force Station Missouri, Fuds Project No. B07MO023204 (USACE 2008).
- Final Supplemental Groundwater Characterization Report, Bishop Tube Site, East Whiteland Township, Chester County, Pennsylvania (Baker 2004).
- A study of Managing Decision Uncertainties using the Triad Approach (SDPRCF 2015).
- Virginia DEQ’s Northern Region Petroleum Program current understanding of the Robinson Terminal North – the former Washington Post paper depot (VDEQ 2017).
- High Resolution Site Characterization: A Sustainable Risk Management Approach (Fiacco 2010).
- The Triad Approach to Managing, Decision Uncertainty for Better Cleanup Projects (USEPA 2004).
- Membrane Interface Hydraulic Profiling Tool (MiHPT) (Cascade 2019).
- Membrane Interface Probe (MIP) Standard Operating Procedure (Geoprobe 2015b).
- USEPA CLU-IN, Membrane Interface Probe (MIP) (USEPA 2018c).
Click here to download the entire document.

