
9.8 Waterloo APS, CPT, and LIF Data Update CSM and Help Optimize Selected Remedy at a Former Refinery in Oklahoma
| Hank Unterschuetz Oklahoma Department of Environmental Quality Oklahoma City, OK [email protected] |
Amy Brittain Oklahoma Department of Environmental Quality Oklahoma City, OK [email protected] |
| Information presented in this case study is based on investigations conducted by ERM. | |
A former refinery in southern Oklahoma stretches over 400 acres with a long operational history. It was first constructed in the 1920s and operated until 1983 through multiple expansions and changes in ownership (ERM 2015). Soil and groundwater at the site are contaminated with VOCs, PAHs, and metals. In addition to the presence of LNAPL, a previous soil-vapor investigation identified new areas potentially contaminated with LNAPL. Previous investigations were not focused on the horizontal and vertical extent of dissolved-phase groundwater contamination, contaminant mobility, and associated risk(s) to receptors. The risk pathway of highest concern is a nearby stream, located on the eastern boundary of the site.
Although much of the site is underlain by shallow sedimentary bedrock (sandstone with siltstone and mudstone inclusions), the portion of the site closest to the stream is underlain by quaternary-age alluvium, which overlies the sedimentary bedrock (see Figure 9‑34). The alluvium consists of silt to fine-grained sand with silty or sandy clay and is thickest along a valley located immediately west of the stream. Groundwater within the alluvium discharges to the stream, presenting the most significant risk pathway for site contaminants (ERM 2013b).
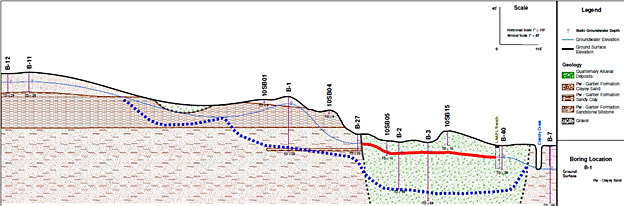
Figure 9‑33. West-east site geology cross section.
9.8.1 Waterloo Advanced Profiling System (APS)
The Waterloo APS was used to collect groundwater samples for analyses of VOCs, SVOCs, and metals at multiple vertical intervals from multiple boring locations in the portion of the site underlain by alluvium. Using a direct push method for sample collection in conjunction with a mobile laboratory for real time sample analysis allowed for extremely quick sampling and decision making.
The Waterloo APS is a direct-push, real-time measurement tool that provides hydro-stratigraphic data and allows for discrete-interval water sampling. The instrument reports a continuous log of the Index of Hydraulic Conductivity (Ik) by injecting a small amount of clean water into the geologic formation as it is being pushed. The tool monitors the depth, pressure, and flow rate of the injected water, and generates a continuous log of relative permeability of the formation. With this knowledge, the user can select intervals for sample collection. Multiple discrete-interval groundwater samples can be collected from a single boring without having the remove the tooling for sample collection or decontamination (ERM 2013b).
The Waterloo APS collects groundwater samples from a 2- to 5-inch vertical interval, which is a much narrower sample interval than a traditional monitoring well screen. Because the sample is collected from a narrow interval, samples from the Waterloo APS often have higher concentrations than a traditional monitoring well samples, which represent the average groundwater concentration across the well screen interval (often several ft). For these reasons, Waterloo APS is deemed a conservative environmental sample and is useful for efficiently and accurately delineating dissolved phase contamination, and for identifying locations where wells should be installed for future monitoring or recovery.
Groundwater from the entire eastern site perimeter and part of the southern site perimeter was evaluated. Thirty-eight borings were advanced and 52 groundwater samples were collected from the most permeable zones within the alluvium using the Waterloo APS (see Figure 9‑34). Results indicated no groundwater contamination on the southern boundary of the site and revealed previously unknown contamination on the northeast site boundary. The dissolved-phase data gathered was used to accurately determine locations and appropriate screening intervals for the installations of a limited number of additional monitoring wells (ERM 2013a).
The Waterloo APS was only one tool used in this site-wide application of direct-push tools. Combined with the information gleaned from CPT and LIF, the complex subsurface was better characterized efficiently. After monitoring wells were installed, the CSM was updated and used to guide various remedial actions. Current remedial actions to remove petroleum related wastes in the subsurface adjacent to the creek have been efficient and effective because of the high-resolution site characterization data generated by the Waterloo APS and other direct-push methods.
The conventional approach to monitoring this risk pathway would have been to install dozens of wells at various screening intervals around the creek and on the boundaries of the site. However, use of the Waterloo APS saved time and better guided well installation (ERM 2015). A total of 16 wells were installed between 20 and 40 ft. Using interval data from the Waterloo APS, new well screens were targeted to characterize dissolved-phase plumes or perform LNAPL bail-down tests which minimized well construction costs while ensuring quality data from the installed wells.
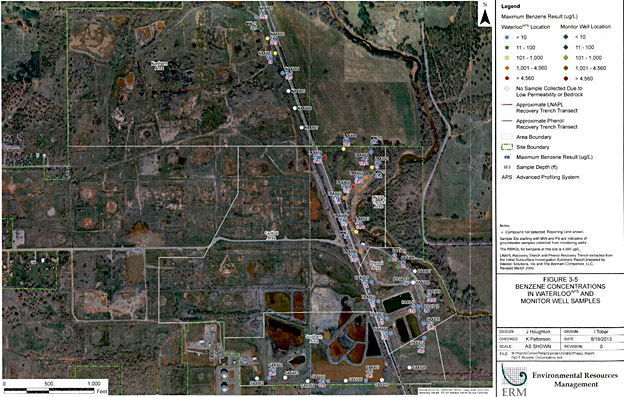
Figure 9‑34. Maximum benzene results at monitoring wells and Waterloo APS locations.
Click here to download the entire document.

