• Skip to main content
itrc_logo

Implementing Advanced Site Characterization Tools

Navigating this Website
1 Introduction
1 Introduction Overview
1.1 Purpose and Scope
1.2 Technologies
1.3 How to Use this Document
2 ASCT Implementation
2 ASCT Implementation Overview
2.1 Tool Selection
2.2 Tool Application
3 Direct Sensing
3 Direct Sensing Overview
3.1 How to Select and Apply Direct Sensing Tools Using this Document
3.2 Membrane Interface Probe
3.3 Optical Image Profiler
3.4 Laser-Induced Fluorescence
3.5 Cone Penetrometer Testing
3.6 Hydraulic and Groundwater Profiling Tools
3.7 Electrical Conductivity (EC) Probe
3.8 Flexible Liners
4 Borehole Geophysics
4 Borehole Geophysics Overview
4.1 How to Select and Apply Borehole Geophysical Tools Using this Document
4.2 Fluid Temperature
4.3 Fluid Resistivity
4.4 Mechanical Caliper
4.5 Optical Televiewer
4.6 Acoustic Televiewer
4.7 Natural Gamma Logging
4.8 Borehole Flow Meters
4.9 Advanced Borehole Logging Tools
5 Surface Geophysics
5 Surface Geophysics Overview
5.1 How to Select and Apply Surface Geophysical Tools Using this Document
5.2 Electrical Resistivity Imaging
5.3 Ground Penetrating Radar
5.4 Seismic Methods
5.5 Electromagnetic Surveys
6 Remote Sensing
6 Remote Sensing Overview
6.1 How to Select and Apply Remote Sensing Tools Using this Document
6.2 Drones
6.3 Visible Spectrum Camera
6.4 Camera Features
6.5 Photogrammetry
6.6 Sample Collection and Monitoring using Drones
6.7 Cost Considerations
6.8 Case Studies
7 Stakeholder and Tribal Perspectives
8 Regulatory Perspective
8 Regulatory Perspective Overview
8.1 Challenges and Solutions
9 Case Studies
9 Case Studies Overview
9.1 MIP Boring Data Allow On-Site Decisions to Fill Data Gaps and Reduce Uncertainty during Triad Approach Evaluation at Five South Dakota Sites
9.2 MIP Allows Real-Time Identification and Delineation of DNAPL Plume at a Former Naval Air Station in California
9.3 OIP-Green Probe Delineates Extent of Coal Tar NAPL at a Former Gas Manufacturing Plant in Kansas
9.4 LIF Survey with UOVOST® Provides More Accurate Representation of LNAPL Plume at a Former Bulk Petroleum Storage Facility in New Hampshire
9.5 UVOST Differentiates LNAPL Types to Allocate Financial Liabilities at a Retail Petroleum Facility in Tennessee
9.6 TarGOST Determines DNAPL Extent and HPT Confirms Site Lithology at a Former Creosote Facility in Louisiana
9.7 CPT Borings and Hydropunch Sampler Optimize Site Characterization at an Aviation Industrial Complex in California
9.8 Waterloo APS, CPT, and LIF Data Update CSM and Help Optimize Selected Remedy at a Former Refinery in Oklahoma
9.9 Conceptual Site Model Development Using Borehole Geophysics at the Savage Municipal Water Supply Superfund Site in New Hampshire
9.10 ERI Provides Data to Improve Groundwater Flow and Contaminant Transport Models at Hanford 300 Facility in Washington
9.11 Surface and Borehole Geophysical Technologies Provide Data to Pinpoint and Characterize Karst Features at a Former Retail Petroleum Facility in Kentucky
9.12 GPR Data Show Location of Buried Debris and Piping Associated with a Former Gas Holder in Minnesota
9.13 Resistivity, Seismic Exploration, and GPR Provide Data to Evaluate Clay Reserves at a Commercially Mined Pit
9.14 Seismic Refraction, Electric Resistivity, and Multichannel Analysis of Seismic Waves Provide Data to Locate Monitoring Well Locations in a Mixed-Use Area in Northern Virginia
9.15 Surface Geophysical Methods Provide Data to Identify Prospective Utility Waste Landfill Sites in Karst Terrain in Missouri
9.16 Airborne Time-Domain Electromagnetic Method Maps Sand Distribution along the Illinois Lake Michigan Shore
9.17 Drone Technology Expedites and Streamlines Site Characterization at a Former Golf Course in Missouri
9.18 High-Resolution and Thermal Aerial Images Identify Mine Openings at an Abandoned Colorado Mine
9.19 RPAS Collects Water Samples to Avoid Safety Concerns at Montana Tunnels Mine
Additional Information
Appendix A. Tool Tables and Checklists
Glossary
References
Acronyms
Acknowledgments
Team Contacts
Document Feedback


Click for Selection Tool Click for Summary Tables Click for Tool Descriptions Click for Case Studies Click for Checklists Click for Training Videos Click for Home

9.10 ERI Provides Data to Improve Groundwater Flow and Contaminant Transport Models at Hanford 300 Facility in Washington

Lee Slater
Rutgers University Newark
Newark, NJ
[email protected]

The ERI method, also known as electric resistivity tomography (ERT), is used to noninvasively determine the spatial variations (both laterally and with depth) of the electrical resistivity of the subsurface (see Section 5.2 for details). At the U.S. Department of Energy’s Hanford 300 Facility in Richland, WA, ERI was used to improve the understanding of the hydrogeological framework regulating the exchange of groundwater with surface water. The basic geology of the site is described as a coarse-grained aquifer (the Hanford Formation) underlain by a lower permeability, fine-grained confining unit (the Ringold Formation). The thickness of the Hanford Formation varies between 14 m (45.9 ft) and 17.5 m (57.4 ft) in boreholes close to the Columbia River, with thickness increasing inland. Due to historical nuclear waste processing and disposal at the site, radionuclide-contaminated groundwater may have been discharged into the Columbia River. Of concern is the possible presence of relict paleochannels incised into the Ringold Formation that could act as permeable pathways for contaminants to rapidly migrate from the aquifer into the river. The risks of radionuclide contamination result in a high cost of drilling at this site; ERI is a more cost-effective investigation technique.

Two-dimensional resistivity surveying was performed to investigate variations in the depth to the Hanford-Ringold contact across the site and identify evidence for incisions in the Ringold Formation that might represent paleochannels (see Figure 9‑38). The rationale for applying ERI was the expected strong contrast in electrical resistivity between the coarse-grained Hanford sediment (more resistive) and the fine-grained Ringold sediment (less resistive). A series of parallel, 2-D ERI lines was acquired on 400- to 500-m-long lines using a 5- and 10-m electrode spacing (see Figure 9‑38a). Challenges faced in deploying these lines included steep terrain and high contact resistances due to dry soil. The latter was overcome by watering electrodes with a high-salinity solution.

The resulting images of an approximately 40-m investigation depth clearly defined the Hanford-Ringold contact and identified locations close to the river where the resistivity structure suggests the presence of paleochannels (see Figure 9‑38c). An interpolated plan view showing the elevation of the sharp contrast in electrical resistivity representing the Hanford-Ringold contact (constructed using the 10 2-D transects shown in Figure 9‑38) is presented in Figure 9‑38. This figure also highlights (1) the path of a key paleochannel that coincides with the location of temperature anomalies from distributed temperature sensing (DTS) indicative of pronounced groundwater-surface water exchange, and (2) high uranium concentrations sampled in the river sediment. The DTS was performed using a fiber-optic DTS line placed along the river bed; temperature is inferred by scattering light transmitted along the cable. Uranium contours are based on concentrations measured in the boreholes (see Figure 9‑39) across the site.

The 2-D assumption used in the inversion of the ERI dataset is reasonable for the lines parallel to the river, as evident by the strong similarity in structure between these lines. Simplified logs from two boreholes that were drilled at the site confirm that the imaged depth to the Hanford-Ringold contact is reasonable, given the inherent smoothing and limited resolution of the technology at depth. The results of this survey have been used to improve groundwater flow and contaminant transport models at the site.

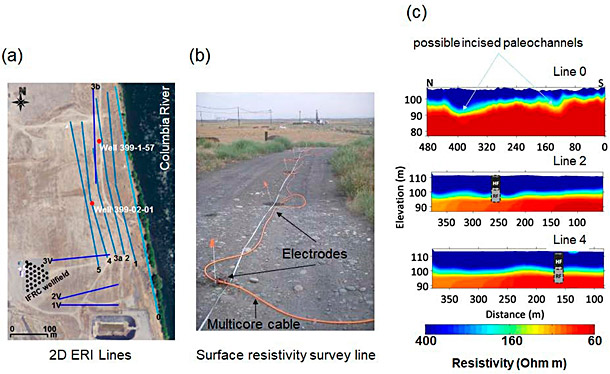
Figure 9‑38. ERI survey at the DOE Hanford 300 Area, Richland, WA: (a) 2-D ERI survey line locations, (b) example of line showing site conditions and multicore cable/electrodes, (c) example 2-D images for three of the 10 lines showing strong electrical contrast between Hanford Formation (HF) and Ringold Formation (RF), with location of two boreholes with simplified log shown.
Source: Modified from (Mwakanyamale et al. 2012)

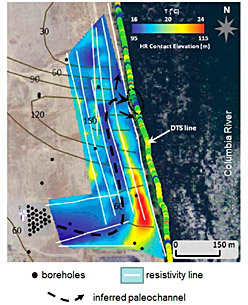
Figure 9‑39. Elevation of Hanford-Ringold contact compared to temperature anomalies (from distributed temperature sensing [DTS]) showing [1] groundwater-surface water exchange locations, and [2] contours of uranium concentrations (mg/L) in aquifer from boreholes.
Source: Modified from (Mwakanyamale et al. 2012)

image_pdfPrint this page/section
Click here to download the entire document.


ASCT-1

web document
glossaryASCT-1
Glossary
referencesASCT-1
References
acronymsASCT-1
Acronyms

ITRC
Contact Us
About ITRC
Visit ITRC
social media iconsClick here to visit ITRC on FacebookClick here to visit ITRC on TwitterClick here to visit ITRC on LinkedInITRC on Social Media
Permission is granted to refer to or quote from this publication with the customary acknowledgment of the source (see suggested citation and disclaimer). This web site is owned by ITRC • 1250 H Street, NW • Suite 850 • Washington, DC 20005 • (202) 266-4933 • Email: [email protected] • Terms of Service, Privacy Policy, and Usage Policy ITRC is sponsored by the Environmental Council of the States.