
9.15 Surface Geophysical Methods Provide Data to Identify Prospective Utility Waste Landfill Sites in Karst Terrain in Missouri
| Elanz Siami-Irdemoosa Missouri Department of Natural Resources Jefferson City, MO [email protected] |
A 42-acre utility waste landfill (UWL) is permitted through the Missouri Department of Natural Resources (MDNR) to receive coal combustion residuals from the combustion of coal at the John Twitty Energy Center (JTEC). The JTEC is a coal-fired power station located at the southwest boundary of the City of Springfield in Greene County, Missouri (Springfield 2016). As the existing UWL was filling to capacity, a new UWL was required to be located and developed at the 800-acre JTEC site.
The bedrock surface at the site consists of Burlington-Keokuk Limestone. Its thickness may vary from 150 ft to 250 ft due to high degree of weathering. The weathered and irregular bedrock is hidden below a mantling of chert clay residuum with thicknesses varying from a few feet to over 40 ft. Most karst features in southwest Missouri are developed within this formation, which includes solution-widened joints, pinnacles, solutional sinkholes, and collapse sinkholes (MDNR-SWMP 2015). The MDNR had two main concerns in siting a UWL in karst terrain: 1) ensure sinkhole collapses do not result in failures of the landfill liner system or instability of the landfill foundation and 2) monitor the uppermost continuous aquifer beneath the landfill. ERT and MASW methods were selected to characterize the nature and extent of the karst system at the site and identify a suitable UWL site (MDNR-SWMP 2015). ERT and MASW techniques have proven to be the best geophysical methods for investigations in karst terrain, particularly when the overburden soil is clay dominated (Van Nostrand and Cook 1966); (Frankline et al. 2019); (Zhou, F. Beck, and B. Stephenson 2000). The high contrast in resistivity values between carbonate rock and clayey soil allows the determination of the soil-bedrock contact (Siami-Irdemoosa 2017).
A total of 374,922 linear ft of ERT data was acquired along 183 traverses. The length of the traverses varied from 625 ft to 8,680 ft. ERT data were collected mostly along parallel west-east oriented and north-south oriented traverses. MASW data were acquired at 240 specific locations along west-east oriented ERT traverses and (mostly) at 400 ft intervals (see Figure 9‑54) (MDNR-SWMP 2015).
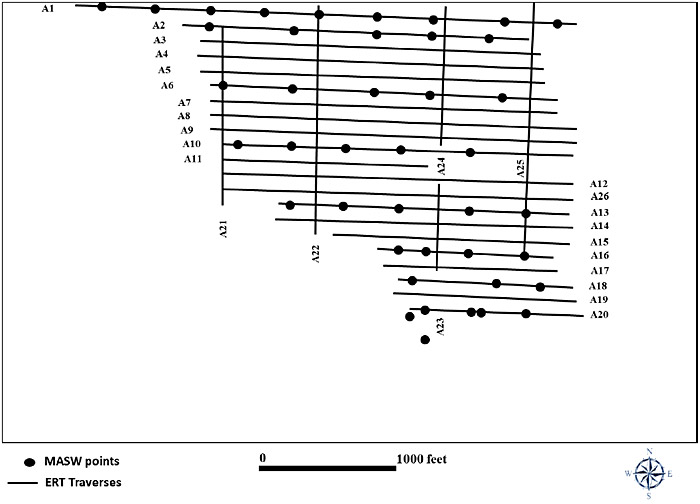
Figure 9‑54. Layout of ERT traverses and MASW locations at the investigation site (Area A).
Source: (Siami-Irdemoosa 2017)
ERT data were interpreted to map the soil-bedrock interface, soil thickness, variation in rock quality, and joint sets and to characterize the existing sinkholes (see Figure 9‑55b). The MASW data were also interpreted to map the soil-bedrock interface, map variation in soil thickness, determine the engineering properties of soil and rock, and validate the ERT interpretation (especially with respect to mapped top of rock) (see Figure 9‑55a and Figure 9‑55c) (MDNR-SWMP 2015).
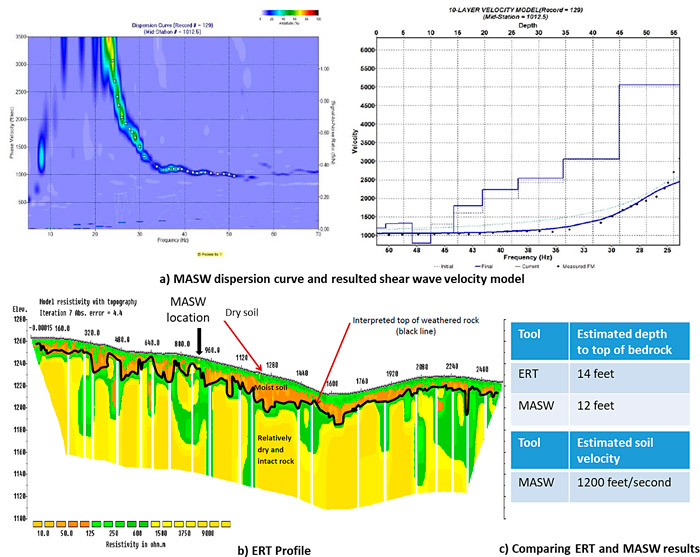
Figure 9‑55. ERT and MASW data interpretation; a) MASW array dispersion curve and shear-wave velocity model.
Source: (MDNR-SWMP 2015)
The geophysical surveys were complemented by site reconnaissance, confirmatory drilling, downhole video, and downhole LiDAR. Data from fifteen (15) boreholes were correlated with the interpreted ERT profiles and MASW data to validate the interpretation. A hollow-stem auger was used to drill the boreholes on the bedrock surface, and the bedrock was core drilled using HQTM core barrels and NQTM core barrels. A corehole encountered a subsurface void immediately east-southeast of a large solutional sinkhole along an ERT profile. A high-resolution downhole camera was used to inspect the subsurface void. An LED-based detection and ranging (LEDDAR) technology was employed to further map the encountered void (MDNR-SWMP 2015).
The primary findings of the site investigation include the following:
- The interpreted soil-bedrock interfaces from ERT profiles and MASW correlate well with borehole control.
- Soil thickness is variable at the site and varies between about 5 ft and 30 ft.
- Two sets of visually prominent orthogonal joints were identified on site: the north-south trending joint sets and the west-east trending joint sets. The north-south trending joint sets are more prevalent on site, with a density of approximately 1/100 ft. The density of the west-east trending joints sets is approximately 1/200 ft.
- Aerial photographs of the site revealed that most visually prominent joint sets are associated with either cultural features that concentrate runoff, natural surface drainage features, or confirmed sinkholes. Over half of the identified visually prominent joint sets are culturally influenced and more than 80% are cultural or drainage influenced.
- A few numbers of solutional sinkhole, collapse sinkhole, and closed depressions were identified during the site reconnaissance. The potential for a sinkhole collapse is low based on the investigation findings.
Based on the results of ERT survey, MASW control and supplemental investigation, two prospective sites were identified as the best alternatives for UWL development.
Click here to download the entire document.

