
9.4 LIF Survey with UOVOST® Provides More Accurate Representation of LNAPL Plume at a Former Bulk Petroleum Storage Facility in New Hampshire
| Joshua Whipple NH Department of Environmental Services MtBE Remediation Bureau Concord, NH [email protected] |
| Information presented in this case study is based on investigations conducted by GeoInsights, Inc. and Columbia Technologies |
In 2006, an investigation was performed at a former petroleum bulk storage facility in Conway, New Hampshire. The site occupies an area of approximately 0.9 acre and abuts the Conway Scenic Railroad to the north. During the investigation, soil and groundwater contaminated with petroleum were discovered in the area of a former fueling rack. Subsequent soil and groundwater investigations revealed the presence of LNAPL in the central area of the site where the fueling rack, pump house, and product piping were formerly located. A dissolved-phase petroleum contaminant plume was also discovered extending off site to the north (see Figure 9‑13).
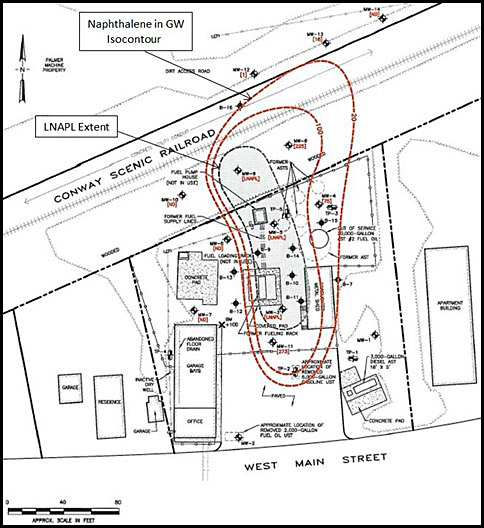
Figure 9‑13. Site Plan showing extent of LNAPL observed in monitoring wells (GeoInsight 2009).
The investigation included the installation of 30 soil borings using a direct push method and 18 monitoring wells using hollow-stem augers. Soil beneath the site consisted primarily of loose to medium-dense, stratified, tan fine sand with lesser amounts of medium sand and interbedded silt (GeoInsight 2007) to depth of 20 ft below ground surface. The water table was observed at depths ranging from 10 ft to 15 ft below ground surface and fluctuated an average of 2.5 ft over six years of groundwater monitoring. LNAPL was observed in three of the monitoring wells at thicknesses ranging from 0.04 to 0.93 foot.
Based on soil sampling and field screening results, most of the soils impacted above NHDES Soil Remediation Standards (SRS) were observed at depths between 10 ft and 16 ft (see Figure 9‑14), with shallower impacts observed in the area where LNAPL was present. Elevated field-screening results above 100 mg/l were observed at a maximum investigation depth of 20 ft below ground surface. The dissolved plume, defined mainly by naphthalene concentrations above New Hampshire’s Ambient Groundwater Quality Standard, extended off site beneath the railroad tracks and the adjacent property to the north.
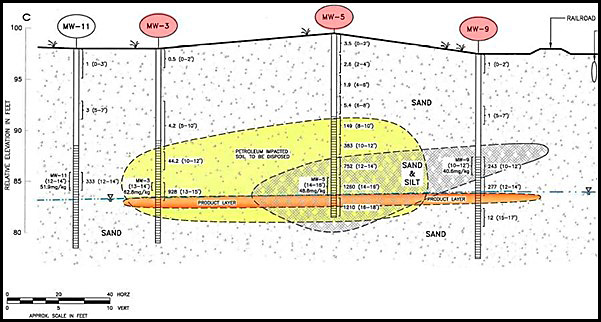
Figure 9‑14. Initial cross section showing the vertical extent of petroleum impacted soil and LNAPL observed in monitoring wells (GeoInsight 2010).
Although the site investigation facilitated a good understanding of site geology and the horizontal extent of soil and groundwater impact, the following constraints were observed:
- A lack of sufficient soil data due to many of the soil samples being collected through hollow stem augers with a 2-foot split spoon sampler every five ft.
- Insufficient soil sample recovery with an average of approximately 50%, in the sandy subsurface material.
- The investigation was conducted over several phases resulting in inconsistent soil descriptions.
- Several of the soil borings were only advanced to the initial depth of the water table resulting in elevated field screening results and SRS exceedances at the deepest extent of the investigation
With questions regarding the vertical extent of soil and LNAPL impact, the project team considered other investigation techniques. Initial cross sections (see Figure 9‑14) present the LNAPL thickness observed in the monitoring wells. This creates a misperception that LNAPL is only present in a distinct layer rather than varying degrees of LNAPL saturation that may actually be present. Because of the favorable drilling conditions and a release that consisted mainly of heavier heating oil petroleum product, a soil boring program using LIF/UVOST® was conducted in 2011. A total of 26 UVOST® borings were advanced using a Geoprobe direct-push drilling rig with a LIF probe (Columbia 2011).
Eight of the UVOST® borings exhibited fluorescence greater than 50% RE, and six borings had a response greater than 25% (see Figure 9‑15, Figure 9‑16 and Figure 9‑17). When compared to waveforms of common petroleum products, the resulting wavelengths were closest to the diesel standard, which was consistent with the historical site use. The UVOST® investigation results revealed LNAPL at depths of up to 7 ft below the water table, much deeper than originally anticipated. The thickness of the zone impacted by LNAPL was measured up to 7 ft rather than the approximately 1-foot thickness observed in the monitoring wells.
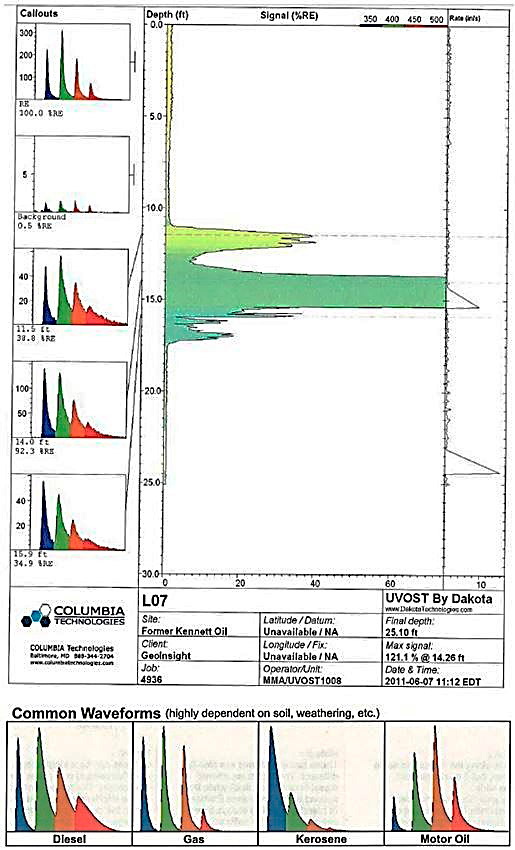
Figure 9‑15. Log from one of the soil borings within the former fueling rack area (Columbia 2011).
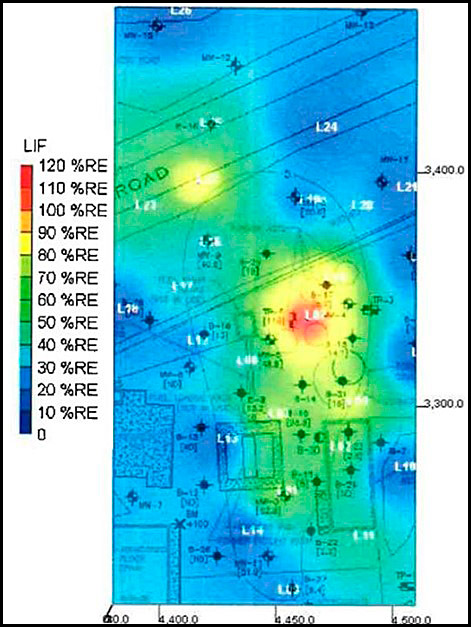
Figure 9‑16. Areal extent of LNAPL detection (Columbia 2011).
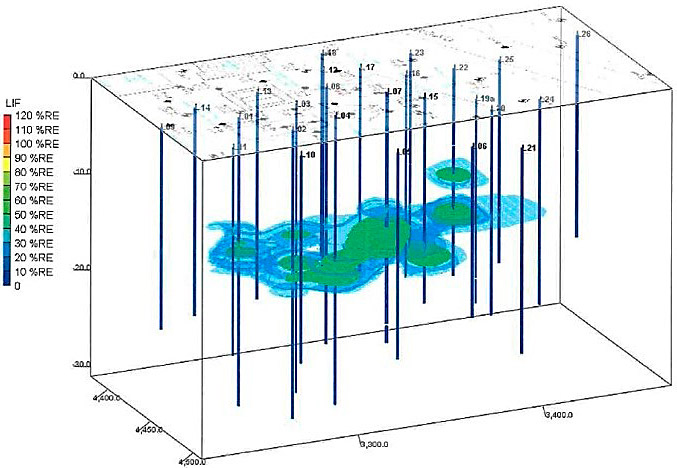
Figure 9‑17. 3D representation of LNAPL detection (Columbia 2011).
The UVOST® data were incorporated into the existing CSM to show that the LNAPL impact appears more like the vertical equilibrium LNAPL plume model with LNAPL at residual saturation on the fringes of the plume and depths below the water table (see Figure 9‑18 and see ITRC’s Technical Guidance Document “LNAPL Site Management: LCSM Evolution, Decision Process, and Remedial Technologies” [LNAPL-3] (ITRC 2018) for more detail on LNAPL plume characteristics).
The total cost for the UVOST® was approximately $30,000 investigation with roughly half of the cost attributed to engineering and consulting oversight and half for the UVOST® contractor. The project field work spanned one week and resulted in a relatively detailed summary report updating the CSM and evaluating potential remedial alternatives to address the more accurate representation of the site conditions.
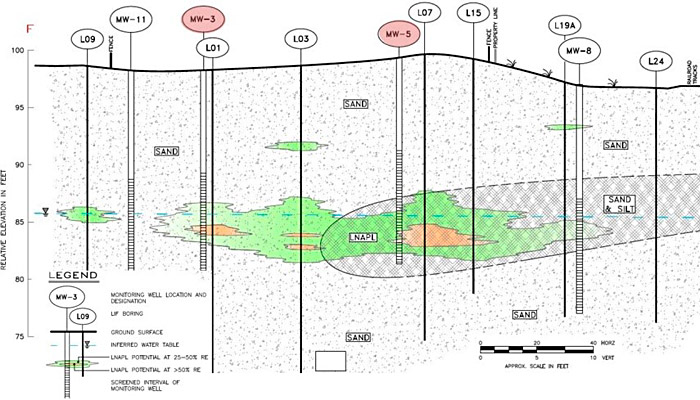
Figure 9‑18. Areal extent of LNAPL detection (GeoInsight 2011).
Although suggesting additional soil characterization at a site where several soil borings and wells have already been installed can be difficult, this investigation demonstrates the value of doing so. Ultimately, soil excavation was determined to be the most appropriate remedial approach, and, in 2012, approximately 6,300 tons of petroleum-contaminated soil were removed. Because of LIF survey results, the soil volume to be excavated was defined, a more accurate request for proposal was prepared for bidding contractors, and a chance for complete removal of the source material was improved.
Click here to download the entire document.

