
6 Remote Sensing
Remote sensing technology acquires information from a distance and has traditionally depended on aircraft or satellites for gathering data. This document focuses on remotely piloted aircraft system (RPAS). This terminology is used by the U.S. Federal Aviation Administration (FAA) for aircraft operated without the possibility of direct human intervention from within or on the aircraft (see 14 CFR 107.3). Other terms like remotely piloted vehicle (RPV), unmanned aircraft systems (UAS), unmanned aerial vehicle (UAV), or small unmanned aircraft system (SUAS) are commonly used. In this section, the colloquial term drone is used to refer to a vehicle with or without attached remote sensing equipment that legally operates under Part 107 of the FAA regulations (for example, weighs ≤55 pounds, including cargo or payload, and operates under 400 ft). This document does not address operations not covered under Part 107 (medium-altitude, long-endurance). see Section 6.2.5 for a summary of Part 107.
Using drones with remote sensors for site characterization is relatively new but rapidly becoming commonly used because of several important technological developments, including improved battery efficiency; compact and lightweight onboard computers; increased data-storage capacity; and inexpensive, widely available, and generally reliable high-resolution lightweight cameras. These hardware changes are coupled with new practical features (for example, autonomous flight, which can precisely fly the drone along predetermined flight paths with limited human control). As a result, data collection that previously required workers to traverse difficult terrain on foot can now be performed with a drone. Drones also have the ability to fly into potentially hazardous areas keeping people out of harm’s way. Under Part 107, drones must fly at altitudes less than 400 ft above the ground, which is advantageous to spatial and spectral resolution for both passive and active sensors. Ease of drone deployment supports frequent, routine flight operations, allowing better recording of and ultimately understanding of temporal changes. Similarly, the evolution of drones is intricately connected to supporting advances in computer processing which enables tremendous amounts of data to be acquired and processed in a relatively quick timeframe.
6.1 How to Select and Apply Remote Sensing Tools Using this Document
Using remote sensing requires a basic understanding of the tools that are deployed and how the sensors collect data. The following remote sensing tools and spectral data collected by drones are discussed in this section:
- visible spectrum camera
- multispectral and hyperspectral camera
- Long-Wave Infra-Red (LWIR) camera
- LiDAR
- photogrammetry software
Visible spectrum aerial photographs and video are the most common products produced using a drone, but there are a variety of other sensors that can be carried by a drone. In general, remote sensors are categorized as passive sensors or active sensors. Passive sensors record reflected, ambient light across a defined EM spectrum. The most commonly used bands include the red band, green band, blue band, near-infrared, red edge, and long-wave infrared (LWIR) bands. Examples of passive sensors include visible spectrum cameras (see Section 6.3), multiple spectrum cameras, and hyperspectral cameras (see Section 6.4.1.11), and LWIR band cameras (see Section 6.4.1.12). Active sensors transmit a signal that is detected when it returns to the source. Common examples of active sensors include light detection and ranging (LiDAR; see Section 6.4.1.13) or radio detection and ranging (RADAR).
Drones can also be used to collect water, air, and soil samples, and collection techniques are rapidly developing. Section 6.6 focuses on water sample collection as the architype physical sampling and, to a lesser degree, air sampling. Soil sampling techniques are being developed but are not ready for commercial application at this time.
Drone applicable technologies are developing rapidly with new tools and with improvements to older tools appearing regularly. These developments are occurring in a highly competitive market such that pricing and performance are improving concurrently. The emerging nature of this technology and its application to site characterization will continue to rapidly evolve over the coming months and years.
Beyond sensors and aerial platforms, significant advances in computing capabilities have allowed for the generation of many useful data products. Desktop and cloud-based software is available for photo stitching and georeferencing of orthomosaics, digital elevation models (DEM), digital surface models (DSM), point cloud, classifying and mapping surface features, performing analyses of plant health, survey maps, and cut/fill volumes of mining and landfills.
This section provides discussion of remote sensing technologies, how they work, appropriate use, advantages and limitations, data collection design, quality controls, data interpretation and presentation. The ASCT Remote Sensing RPAS Summary Table provides information for common sensors used with RPAS. The ASCT Remote Sensing Checklist (.xlsx version) provides information to be considered while preparing for a flight and prior to, during and after a flight.
6.2 Drones
6.2.1 Platform Selection
Key drone components include the airframe, propulsion system, navigation equipment and flight controller (often composed of GPS, on-board stabilization, and autonomous flight computer), and its payload (for example, camera.). When selecting a drone for remote sensing, it is important to consider the basis of the intended payload and type of data collection needed to achieve project objectives. Drones are available in different types and configurations, each providing its own set of unique advantages and disadvantages. It is important to understand the capabilities and limitations of each type when selecting a drone for a specific application. The primary types of drone are as follows:
- fixed wing
- rotary wing (helicopter)
- multirotor
- hybrid
Table 6‑1 summarizes features of the various platform types and may not properly represent certain makes and models of drones. Users should evaluate the performance, cost, and capabilities between several manufacturers before selecting a drone for a specific project.
Table 6‑1. Drone platform summary
| Platform Type | Payload Capacity | Capable of Vertical Take Off and Landing | Complexity |
|---|---|---|---|
| Fixed Wing | High | No | Low |
| Rotary Wing (Helicopter) | High | Yes | High |
| Multirotor | Moderate | Yes | Low |
| Hybrid | Low | Yes | Moderate |
6.2.1.1 Fixed-Wing
Fixed-wing drones are the most power-efficient platform type and can generally fly longer and carry more payload than other drones. The primary disadvantage of fixed-wing aircraft is the need for a suitable take off and landing site. Most small fixed-wing drones are hand-launched because smooth runway areas are often not available. Landing the drone generally takes more space. Landing gear is seldom used, and most aircraft are skid landed. Small fixed-wing drones are commonly constructed of durable expanded polypropylene or expanded polyolefin foams.
6.2.1.2 Rotary Wing
Rotary-wing or helicopter configurations allow hovering and vertical take offs and landings. Rotary-wing drones are more efficient than multirotor drones due to their long and narrow rotor blades. Rotary-wing drones are often used to carry payloads that are too heavy for a multirotor. These drones are more mechanically complex because the rotor blades constantly change pitch through each rotation. Although electronic stabilization systems have reduced the complexity of some of these mechanisms, rotary-wing drones require more maintenance than other drones. One significant advantage of rotary-wing drones is that they can be powered by a single motor, making them well suited to internal combustion or turbine power, which allows the drones to fly much longer than battery-powered aircraft.
6.2.1.3 Multirotor
Multirotor drones, which dominate the current drone market, usually have an even number of electric motors that turn fixed pitch propellers. The four- and six-propeller configurations are most common. The torque of the propeller pairs turning one direction is countered by an opposing torque of propeller pairs turning the other direction. Pitch and roll are accomplished by varying the motor speed. Yaw (rotation around the vertical axis of the drone) is accomplished by varying the speed of propeller pairs to unbalance the torque in the desired direction. Multirotor drones are mechanically simple with as few as four moving parts. Their mechanical complexity is replaced by electronics and software, making them reliable and easy to operate. Multirotor drones are generally battery powered and not as well suited to fuel power; they typically have a flying time duration of less than 30 minutes.
6.2.1.4 Hybrid
Hybrid drones combine vertical take-off and landing capabilities with the ability to transition to a more efficient fixed-wing forward-flight mode. Some hybrid drones use multirotors for lift and a separate motor and propeller for forward thrust. These drone types are called separate lift and thrust. After transitioning to forward flight, the lifting motors are turned off. Some hybrid drones articulate the lifting motors to a forward orientation to transition to fixed-wing mode. Another configuration uses a fixed-wing drone with sufficient thrust from multiple forward-facing motors to achieve vertical take off. This is referred to as a tailsitter and is less mechanically complex because it does not have to use separate lift motors or articulate the motors. The transition from hover to forward flight and then back to hover is challenging to automate, and the performance of each manufacturer’s product depends on both proper aerodynamic and software design. The advantage of the design is increased flight time but is someone hampered by decreased payload capacity. Decreased payload capacity results because it is necessary to vertically lift a wing. Upon take off, this action does not contribute lift to the drone’s flight.
6.2.2 Global Navigation Satellite System (GNSS)
To produce an accurately scaled and geographically positioned dataset, drone position information is required. Two instruments play crucial roles in ensuring the quality of the collected data are the GPS and the inertial measurement unit (IMU). The GPS tracks of the drone location, and the IMU accounts for the effects of roll, pitch, and yaw. Together these instruments track the geographical coordinates during flight and are vital during data postprocessing. Multiple GPS systems are available:
- navigational GPS, sometimes called GNSS as GPS is a subset of GNSS
- real-time kinematic (RTK) GPS
- ground control points (GCPs)
6.2.2.1 Navigational GPS
Most drones have a navigational GPS that enables position holding and autonomous flight functions. The GPS coordinates are inserted into the image exchangeable file (EXIF) data which helps simplify integration into GIS applications. The EXIF often contains information such as aperture, shutter speed, ISO, focal length, camera model, and flight date. Given the value of such data, agencies should consider standards such as the USGS Unmanned Aircraft Systems Data Delivery Specification (USGS 2018d) or others as they develop their specifications. Although the navigational GPS may only be accurate to about 30 ft horizontally, photogrammetry software can produce scaled products suitable for many applications. The relative horizontal accuracy of a photogrammetry product, supported only by navigational GPS, can be accurate to within several ft and precise to within several inches.
6.2.2.2 Real-Time Kinematic GPS
RTK GPS units use at least one additional GPS receiver at a nearby known static position to continuously correct the airborne GPS position. This method provides GPS horizontal accuracies of a few tenths of an inch. Drones using RTK GPS units can produce data with horizontal and vertical accuracies less than 0.5 inches without ground control. RTK has an additional benefit in that it enables the drone to fly and land precisely. When a short loss of communications between the fixed base and the aircraft occurs, the airborne GPS can revert to a less accurate floating mode, resulting in unusable image coordinates.
Postprocessed kinematic (PPK) GPS units have an advantage over RTK GPS units in that a continuous communication link between base and aircraft is not necessary. A base station must be set prior to flight operations. PPK uses logs from the base station or a network of continuously operating reference system (CORS) receivers to correct image coordinates after the flight. Raw logs from the onboard GPS as well as PPK methods can provide equivalent accuracies to RTK methods but require postprocessing that may be complex.
These methods are costly compared to using a navigational GPS or a navigational GPS paired with GCPs (see Section 6.2.2.3). When high-accuracy data are required but deployment of GPCs is dangerous or inconvenient relative to the data needs, RTK may be worth the cost.
6.2.2.3 Ground Control Points
GCPs are an effective way to georeference drone data and greatly improve accuracy for navigational GPS. This method can also be used with images that contain no geographic coordinates. This method involves manually identifying surveyed ground targets within the postprocessing software. Temporary targets are often used but features clearly visible in several photos can be used as GCPs. Products produced using ground control can achieve accuracies of less than 0.1 ft horizontally and vertically. Some software products allow extra targets to be designated as check points. Check points are not used by the software to georeference the point cloud but rather to measure error between calculated and surveyed coordinates.
6.2.3 Data Collection Design
6.2.3.1 Employing Available Imagery to Support Drone Operations
A wide variety of satellite imagery data are available online, much of free. For example, NASA, NOAA, and USGS provide satellite data. It is common practice to use aerial photography available through Google Earth or other platforms when investigating a site. Similarly, airborne LiDAR data are available from the United States Interagency Elevation Inventory (NOAA 2019b). Some other common locations for this type of data include:
- NASA Earthdata Imagery (NASA 2019)
- NOAA Satellite Imagery and Data (NOAA 2019a)
- USGS EarthExplorer (USGS 2019)
An online search of satellite imagery data yields many sources of data. States and local municipalities may also provide imagery data. Available data must be examined prior to collecting data to potentially narrow and focus additional data collection. When using satellite imagery data, note the timeframe of the imagery and how it corresponds to the timeframe of the proposed project. Although imagery data may be available, image processing may be required. Prior to purchasing imagery data, available data should be researched; many states have no-cost LiDAR data available. When weighing the option of employing available remote sensing data versus collecting drone data, it is crucial to know the needed temporal resolution, spatial resolution, and spectral resolutions required for the specific project.
6.2.3.2 Site Specific Considerations
Prior to implementing drone operations at a site, it is critical to evaluate the site-specific physical characteristics that may either impede or improve data collection. Some common considerations include the following:
- Topography changes may impede safe operations and must be considered in flight planning. For example, the amount of overlap needed to produce quality data for both active and passive sensor changes with topography, flight pattern, objects being imaged, and available light. In rugged mountains, the light available to illuminate the pixels on the sensor from a shady slope is relatively weak; the light illuminating the pixels on the sensor from a sunny slope is stronger. Additionally, different objects (for example, rocks verse vegetation) reflect more or less light. These ambiguities can significantly affect remote sensing data accuracy.
- Sun position, cloud cover, and time of day may contribute to lighting effects that negatively impact data collection. Harsh midday light, for example, can cause excessive contrast, blown highlights, hard shadows, and washed images. Changing light conditions, such as dynamic cloud cover, may also cause issues with a passive sensor. Full cloud cover, on the other hand, may reduce shadowing and variations in light intensity. Too much cloud cover or fog may not only block reflected light, but also pose operational safety hazards.
- Ground-cover variations may lead to errors in photo stitching and processing. Ground cover such as snow, water, or tall grass moving in the wind may cause difficulty in finding tie points between images (see Section 6.2.2.1 for more details). Heavy vegetation may also reduce the effectiveness of active sensors in penetrating canopies and may obscure the ground surface from passive sensors.
- Temperature variations in the air or between the ground and the air may influence gradients observed during thermal data collection efforts. Additionally, some sensors have a recommended operating temperature range. Operating outside that range may reduce sensor performance or cause the sensor to fail.
- Water, including ponded water, may obscure active or passive sensors from an aerial platform. Many sensors have a limited ability to penetrate beyond a few centimeters of water.
- Many drones are not designed for use in high winds or rain, and such conditions may influence operational safety and data collection.
6.2.4 Best Operational Practices
The following operational practices were adapted from drone sampling as described in (Castendyk et al. 2017). Drone operations are best performed by a two-person sampling team of a pilot and a spotter. The pilot is responsible flying, defining a safe flight area and ensuring equipment is operating properly. The spotter is responsible for ensuring no one enters the safe flight area, watching for changes in environmental conditions (for example, weather, birds, vehicle traffic); assisting the pilot in positioning the drone over the sample point; and, when using the drone for sampling, collecting the sample(s) when the drone returns.
- Upon arrival at the site, review weather conditions. Moderate to strong wind can make the drone difficult to control. Note that wind speeds are typically lower in the early morning. Precipitation and condensation from fog or clouds can damage exposed circuitry.
- Establish the safe flight area, a 20-ft by 20-ft area delineated with cones or other brightly coloured markers, where the drone takes off and lands. The safe flight area must have an unobstructed, line-of-sight view of media to be sampled or area from which data are being collected. Avoid hazards such as the top of a cliffs, the bottom of highwalls, trees, powerlines, and active vehicle traffic. During drone operations, only the pilot and the spotter are allowed to enter the safe flight area. Typically, the pilot and spotter stand just outside of the area when the drone is turned on and off.
- Prior to flight, install fully charged batteries. Used batteries must be placed in a charging station.
- As appropriate for planned operations, attach sampling equipment and check sensors, controls, and the condition of the drone.
- Thereafter, raise the drone and payload, position the system relative to the sampling point or point at which sensor data collection is initiated. Initiate planned flight pattern or route to sampling point. As noted above, the selected flight pattern should be advantageous for data collection and safe navigation.
- Once the allotted flight time has passed or data collection goals are met, land the drone within the safe flight area. For active sampling, such as water sampling, an experienced team can generally complete Step 5 in approximately 15 minutes to 20 minutes.
- Replace the batteries with a fresh set and repeat Step 5 until all samples or sensor data are collected.
- Prepare the sampling report, which should include at a minimum: (1) notes regarding weather conditions, (2) the sampling and data collection coordinates, (3) the sampling point (in 3-D for water sampling), and (4) justification for the selected sampling point(s) or data collection area.
6.2.5 Regulations and Policies
The FAA recognized the importance of integrating drone operations into the NAS and adopted updated regulations (14 CFR Part 107) in 2016. The FAA presently supports two options for certifying public agency drone operations. The original mechanism was through a blanket Certification of Waiver or Authorization (COA) referred to as a Section 333 exemption. This exemption permitted flight below 400 ft in Class G (uncontrolled) airspace and self-administered pilot certification, with a need to apply for an emergency COA (e-CAO) for special circumstances. These mechanisms also required specific commercial pilot training rather than the current lower level of certification. The initial application process for a COA is extensive and operations remain subject to the application andreview process for e-COA for many flights. The FAA is phasing this out in favor of operations under the Part 107 rule.
Part 107 applies to government entities and commercial operators alike (FAA 2019c). Requirements include remote pilot certification by the FAA (written test), drone registration, and limitations on airspace and operational conditions. The FAA has continued to expedite this program, simplifying the online application process for flights that deviate from the Part 107 requirements (for example, a Certificate of Waiver or Airspace Authorization is required for flights in Air Traffic Controlled airspace, beyond Line-of-Sight, and flights outside of daylight hours) (See FAA Part 107 Waivers (FAA 2019b)).
On August 29, 2016, 14 CFR, Part 107 went into effect for both civil and public use of drones. A new pilot certificate termed the “remote pilot” along with associated testing requirement were part of the rule. The rule also established a registration process for small drones flown commercially. The remote pilot must pass the written FAA exam and register their aircraft. Commercial operation includes work performed for compensation as well as work performed without compensation in the furtherance of a business or for research. Flying drones for educational or instructional purposes (for example, teaching a STEM class or a drone training program) may operate either under Part 107 or as a recreational flier (See FAA Educational Users (FAA 2019a)). Part 107 rules allow small unmanned aircraft to operate with the following summarized restrictions (See FAA Press Release – New FAA Rules for Small Unmanned Aircraft Systems Go into Effect (FAA 2016b):
- Less than 55 lbs
- Visual line-of-sight (VLOS) only
- No operations over unprotected nonparticipants or moving traffic
- Daylight only, civil twilight with lighting visible for three miles
- Drone must yield right of way to other aircraft
- First-person view (video from a drone) requires a visual observer with VLOS
- Maximum ground speed of 100 mph
- Maximum altitude of 400 ft above the ground or a structure
- Weather visibility of at least three miles
- Class G airspace only without air traffic control permission
- One aircraft per pilot
- No operations from a moving aircraft
- No operations from a moving vehicle unless over a sparsely populated area
- No careless or reckless operations
- No carriage of hazardous materials
Unmanned aircraft regulations constitute a large portion of the 2018 FAA Reauthorization Act. The act distinguished between the operational risks associated with manned versus unmanned aircraft. Section 336 was repealed, thereby allowing the FAA more authority to regulate and register hobbyist aircraft. Unmanned traffic management systems, counter drone techniques, fee mechanisms, and the flexibility to regulate a rapidly changing industry are key parts of this act.
The FAA has recently instituted the Low Altitude Authorization and Notification Capability (LAANC), allowing near real-time processing of airspace authorizations for drone operations. Further regulatory changes regarding flying over people, beyond VLOS, and other operational parameters are being released by the FFA on a regular basis.
The FAA’s website is the official source of drone information and registration. Drone regulations are continually evolving, and it is important for pilots to stay up to date on current regulations. Useful resources for drone regulations and information include:
- FAA Unmanned Aircraft Systems web page (FAA 2019c)
- FAA DroneZone web page (FAA 2019d)
- Know Before You Fly web page (KBYF 2015)
The document links below cover the material on the FAA Remote Pilot Airman Knowledge Test:
- Remote Pilot – Small Unmanned Aircraft Systems Study Guide (FAA 2016a)
- US DOT Advisory Circular: Small Unmanned Aircraft Systems (FAA 2016b)
- Part 107 Drone Exam Practice Tests: Questions 1-10 (3DR 2019)
6.2.5.1 Environmental Considerations
Incidents have been reported where birds, particularly large birds of prey, have directly attacked drones. Such attacks could result in damage to the drone and possibly fatal injuries to bird. To protect the drone and wildlife, a spotter equipped with binoculars can constantly scan the flight area to alert the pilot of bird activity. If birds are spotted, drone flight should cease until the birds have exited the area.
6.2.5.2 Legal Considerations
Drone work may require new service agreements or riders to existing agreements and changes in insurance policies, delaying work. It can take time to establish a new contract for drone water sampling owing to legal requirements. Client agreements or aircraft use policies within a company may not have anticipated drone use. Liabilities for aircraft may be based on the crash of a manned-helicopter or fixed-wing aircraft, which grossly overstates the liability related to a drone.
6.2.5.3 Regulatory Considerations
Some drone uses may be new to regulators. It may be helpful to invite regulators to observe a drone water-sampling event. This approach was used in Nevada for the Department of Environmental Protection (Newman et al. 2018) and in Montana for the Montana Department of Environmental Quality (MDEQ) and the U.S. Bureau of Land Management (BLM) (Williams et al. 2018). In these instances, regulators accepted drone water samples for regulatory compliance purposes. After observing the methodology, one regulator wrote, “The methodology is acceptable for regulatory purposes and allows for multiple samples to be collected while maintaining human and environmental safety” (Newman et al. 2018).
6.2.6 Public Acceptance
The potential to invade privacy is a significant concern associated with drone flight. Drone flights, particularly by government and law enforcement entities, are problematic in this regard. While local laws and ordinances can address safety and nuisance concerns, privacy and potential government surveillance are problematic issues. In response to the privacy concerns associated with using drone-mounted cameras, a presidential memorandum dated February 15, 2015 initiated a series of multistakeholder efforts resulting in guidelines for private and commercial use. These voluntary best practices address privacy, accountability, and transparency issues (See Voluntary Best Practices for UAS Privacy, Transparency, and Accountability (NITIA 2016)).
It should be noted that certain drone applications (for example, where a physical sample is collected) (see Section 6.6) may not drive privacy concerns to the same degree as image collection. Thus, when dealing with stakeholders, communicating the goal and product associated with a particular flight may help to alleviate potential concerns.
Regardless of intentions and goals associated with drone use, state and private organizations should establish and enforce drone operating procedures that explicitly protect public privacy.
6.3 Visible Spectrum Camera
Drones have brought aerial mapping within reach due to the ability to scale costs and requirements to a site-specific nature.
With advancements in video technology, aerial video is becoming more popular. Oblique video is commonly shot from drones to assist in site characterization. The unique perspective of aerial videography and photography allows for an unprecedented level of understanding at a variety of sites (large and small). In addition, using geospatial data imbedded in information collected by the drone, video may be embedded with meta data and later synced with a video mapping program. Similarly, photos and video may be georeferenced or attached to geotagged photo locations to provide assistance in site characterization. These basic methods are relatively inexpensive and require a limited infrastructure of software to implement.
Beyond photo and video, the next most common application of drones is the collection of visible spectrum data as a collection of overlapping datasets. Software that can extract three-dimensional information from two-dimensional image data has transformed drones into powerful mapping and surveying tools.
The drone camera is the tool most often used in site characterization due to its low cost, high availability, and simplicity of the self-explanatory nature of a picture. Additionally, the operational requirements and technical knowledge required to use a camera are low relative to other sensors. Off-the-shelf camera drones cost approximately $1,000 or more. Detailed technical information about these cameras is provided in the following sections. Similar but abbreviated technical information is available in the ASCT Remote Sensing RPAS Summary Table for other common sensors.
Photos and video can be used for inspection, documentation, change detection, and many other purposes. Low-altitude photos and video can yield valuable information about a site that is not apparent from ground observations.
Drones flying less than 400 ft above the ground allow ground sampling distances of inches or less versus feet for conventional visible spectrum aircraft photography. Drones often use wide-angle lenses which are less prone to distortion due to vibration than longer lenses. Using a gimbal to stabilize a wide-angle lens can yield focused images in a variety of lighting conditions. In many areas of the country, atmospheric haze is a common problem when obtaining aerial photographs. Drone sensors benefit from less atmosphere between the subject and sensor and, thus, less distortion from atmospheric interference or weakening of specific EM bands.
Furthermore, in most cases, uncorrected photographs are of less use than the postprocessed outputs. The most recognized postprocess image is the orthomosaic. Orthomosaics are geometrically corrected to remove distortion caused by topographic relief, lens distortions, and camera position. The orthomosaic can be used to measure true distances because it is an accurate representation of the Earth’s surface. Organizations should consider the need for and methods to archive not only the uncorrected photos but the processed products.
6.4 Camera Features
This section provides basic information for properly selecting and using a camera in drone operations. The visible spectrum camera is a model for other sensors and their characteristics; therefore, most lessons that apply to it also apply to sensors that collect spectral data outside the visual range (for example, hyperspectral and infrared cameras).
6.4.1 Camera Spatial Resolution
Spatial resolution is a measure of the finest detail distinguishable in an image and is determined by the sensor dimension and pixel pitch (aperture), focal length, and distance from the object being imaged (see Figure 6‑2). For drones, the distance from the object is typically the height above the ground.
6.4.1.1 Sensor Dimensions
Sensor dimension is equivalent to the film base in a film camera. A large sensor collects more light, which corresponds to a better image. The dimensions of a sensor are described by two parameters: size and aspect ratio.
Generally, a larger sensor is preferred because a larger sensor receives more light and allows for a wider ISO while reducing noise. Sensor size is reported in inches based on optical format, which is larger than the true diagonal size of the sensor. The diagonal length of the sensor multiplied by 3/2 is approximately the sensor width reported in inches. For example, a 6.4-mm by 4.8-mm sensor has a diagonal of length of 8.0 mm and an optical format of 8.0 x 3/2 ≈ 12 mm. This value converts to about 0.5 inches and therefore designated a 0.5-inch sensor.
Aspect ratio describes the screen shape in a height-to-width ratio of the displayed image. Two choices exist: 4:3 and 16:9. An aspect ratio of 4:3 is squarer; an aspect ratio of 16:9 corresponds to modern computer monitors. CCD sensors have an aspect ratio of 4:3. Complementary metal–oxide–semiconductor (CMOS) sensors have an aspect ratio of 16:9, although some CMOS cameras allow selection of either ratio. The squarer 4:3 aspect ratio is created by cropping the sides of the 16:9 aspect ratio image, decreasing the field and spatial resolution. An aspect ratio of 16:9 is preferred for images displayed and processing on a modern computer monitor, but CDDs have other advantages and are discussed with sensor types.
6.4.1.2 Pixel Pitch
While sensor size and aspect ratio describe the physical size of the sensor, a sensor may also vary in pixel count. Pixel pitch relates the width of an individual pixel on a sensor to sensor width. To compare sensors, the sensor’s size and absolute number of pixels must be compared by using pixel pitch (see Figure 6‑1). Pitch is calculated by dividing the sensors width by the number of pixels in a row on the sensor. As an example, the sensor size of a Phase One iXU 1000 drone camera is 53.4 mm by 40 mm and the pixel count is 11,608 by 8,708. Using one side of the rectangular sensor, the pixel pitch is 40 mm/8,708 pixels = 0.004593 mm/pixel, reported as 4.6 microns. When two sensors have the same number of pixels, the larger sensor has the better image. It is possible for the smaller sensor to have many more pixels and, therefore, it will have a better image. Pixel pitch balances these two sensor aspects; generally, a smaller pixel pitch provides greater resolution.
6.4.1.3 Aperture
Aperture is usually denoted by the f-number, which is the ratio of the focal length to the diameter of the opening (length over diameter; see Figure 6‑1). Thus, f/2 is an aperture with a diameter 1/2 the size of the focal length of the lens, f/4 is 1/4 the size of the focal length, and f/1.0 is an opening equal to the focal length. The larger the value in the denominator, the smaller the aperture opening. For digital cameras, pixel size is equivalent to the aperture opening that allows light through the lens in a film camera. The smaller the opening through which light must enter, the greater the spreading of light (diffraction). A larger pixel pitch is equivalent to a larger opening for light and, therefore, less diffraction.
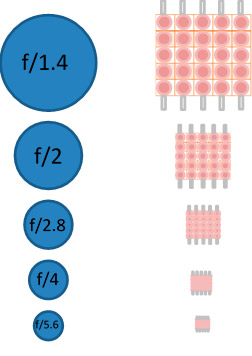
Figure 6‑1. Comparison of aperture to pixel pitch.
Figure 6‑1 allows a comparison between aperture and sensor pixel size. As seen in the Figure 6‑1, two sensors may have different physical sizes but the same pixel counts. Alternatively, pixel count can vary for sensors of the same size. Thus, pixel size and pixel count both influence image quality. The aperture, denoted by f-number, is the ratio of focal length to pixel size (the opening allowing light to enter the camera).
Presently, small drones may use small CMOS sensors like a mobile phone camera sensor. For environmental work, where we assume larger drones and emphasize picture quality, it is expected that the sensor is, generally, 1/2.3 inch or larger CDD. In the drone market CDD sensors presently dominate. This statement is constantly being tested as new CMOS sensors are developed, so check contemporary research.
6.4.1.4 Focal Length
The second key element that influences spatial resolution is focal length, which is the distance between the lens and sensor when the camera is correctly focused on an object. (In textbooks, focal length is described as that same distance when the object is at infinity.) Focal length is a characteristic of the lens. Typically, drone cameras have focal lengths from 10 mm to 1,200 mm. Shorter focal lengths (effective focal lengths of 24 mm to 35 mm) are best for producing quality pictures when the drone is flying at typical operational height (above 50 ft) because distortion is reduced in images taken for larger geospatial applications. If a drone is used as an inspection camera to inspect a stack, a longer focal length would perform better.
The relationship between actual focal length and the focal length of a full 35-mm camera is expressed as a focal length multiplier called a crop factor. The crop factor of a camera can be calculated by dividing the diagonal length of a 35-mm frame by the diagonal length of the camera sensor. Crop factors are available on the internet and usually provided by the camera or drone manufacturer. The crop factor is a valuable method to compare focal lengths. If a camera has a crop factor of two, a 35-mm film frame is twice as large as the camera sensor.
6.4.1.5 Flight Height
Drone flight height is the distance from the object on the ground to the camera lens and a determinant of spatial image resolution. The further the object is from the camera, the more difficult it is the see clearly. Likewise, if an object is too close, it is also hard to see. Camera settings and flight height may be adjusted to optimize image quality. Camera parameters must be selected to match the intended use of the camera.
6.4.1.6 Ground Sampling Distance
Ground sampling distance (GSD) is a composite concept used to describe spatial resolution in terms of the dimension of a square pixel per area on the ground. Thus, GSD is the distance in the x and y directions that a sensor sees or images. For drones, GSD may be thought of as the area on the ground covered by each pixel when the camera is stationary. For example, a GSD of 2 inches means that one pixel in the image represents two linear inches on the ground or 2 x 2 = 4 square inches. The smaller the distance between pixels (a small GSD) the greater the accuracy of the corresponding ground image. The larger the GSD, the lower the spatial resolution of the image. An aerial survey cannot be more accurate than the GSD.
GSD, as a formula, is the ratio of the sensor width (Sw) times flight height (H) divided by focal length (f) times the object width in number of pixels. Therefore, the GSD is reported in distance per pixel.
(Sensor Size (Width) x Flight Height) / (Focal Length x Object Width in Pixels)
Note the same formula applies to sensor height and object height.
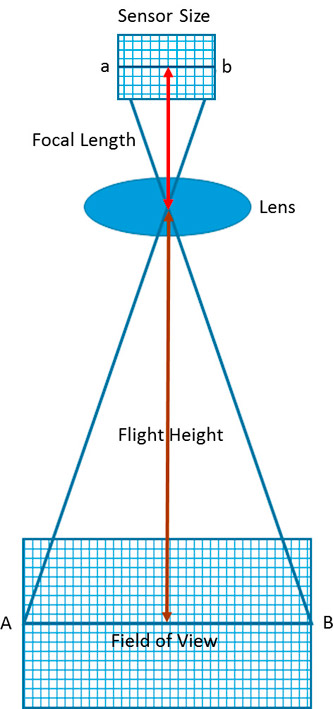
Figure 6‑2. Relationship between sensor dimension, focal length, flight height and field of vision.
Figure 6‑2 illustrates the relationship between sensor dimension (sensor size in x, y, and diagonal), focal length (distance from lens to sensor), flight height, and field of vision. The distance from the object being viewed is the flight height relative to that object. The GSD can be used to determine the proper flight height needed to acquire the desired image. A rule of thumb is to double the GSD; another rule of thumb is that any image you want to see clearly should be covered by 10 pixels to 20 pixels. Using the 20-pixel value, the smallest object imaged should be at least 10 inches in size at 100 ft above the ground. Note: If you reduce the flight height by half, the size of the object clearly imaged doubles.
6.4.1.7 Light Exposure
Three factors control the light exposure of the sensor: ISO, shutter speed, and aperture. Aperture was discussed previously. ISO is the light sensitivity of the digital sensor. Quality drone cameras allow ISO to be adjusted along with shutter speed; adjustability typically ranges between 100 (low sensitivity) to 12,800 (high sensitivity). As a point of perspective, ISO 200 is double the sensitivity of ISO 100. Low ISOs, like 100 or 200, are most often used in low light or when the camera or subject is stationary and the shutter opening is set for a longer time. A lower ISO is less grainy, has better color, and captures details better. In bright light or when either the camera or subject is moving, higher ISO and faster shutter speed are preferred. A higher ISO may result in grainy images because the light had less time to interact with the sensor. Keeping the ISO as low as possible is recommended to achieve the highest quality image (balanced against movement of either the camera or subject).
6.4.1.8 Field of View
Field of view (FOV) measures the area on the surface of the ground that is observed by a single sensor. FOV is similar to GSD, which is the area on the ground observed by a single pixel. The FOV is, however, used to describe the angular extent of the scene that the camera can image. The larger the FOV, the larger the area covered (assuming all other aspects are equal).
6.4.1.9 Gimbal
A gimbal is a camera mount that allows the camera to move up and down and left to right. Using a gimbal allows the camera to stay focused on an object or area of interest regardless of the motion of the drone. For example, the gimbal keeps the camera steady when the drone is buffeted by wind. For stable video footage and quality photos, a gimbal is needed.
6.4.1.10 Camera Settings
Most dronesproduce quality images when the camera settings are the default out-of-the-box camera settings. When collecting images for geoprocessing, the camera should be optimized to do as much of the work as possible without manual adjustments. The shutter speed, aperture, and ISO should be set to automatic. If a test flight results in blurry or noisy images, these parameters should be manually adjusted. There is a tradeoff between the shutter speed, aperture, and ISO sensitivity. Quality images with the least amount of noise are obtained when lighting is bright and consistent, the ISO is relatively low, and the shutter is as open as possible. Poor lighting results in noisy images. A shutter speed that is too fast produces grainy images similar to when there is insufficient light. Poor images interfere with image processing and the accuracy of the results. Initial settings are noted below.
- Shutter speed should be fixed and set to a medium speed (for example, between 1/300 second and 1/800 second) that does not produce blurry images. If more than 5% of the images are subject to a directional blur, the shutter speed should be slightly increased. When adjusting shutter speed, a rule of thumb is to set the speed to double the frame rate. If the picture appears too white or too black, increase shutter speed to reduce white but reduce shutter speed to reduce black.
- ISO should be set as low a value that supports crisp images and does not produce shaky images. In low light, the ISO should be decreased. To reduce noise in the picture, decrease the ISO. For faster flight speeds, increase the ISO. Keep in mind that high ISO in the daylight can produce overexposed and noisy images.
- Aperture should be set to automatic to allow the camera to compensate for changing light levels. When setting the aperture manually, set the aperture as low as possible. Adjust the aperture before shutter speed.
- Set the focus on infinity or automatic when flying above 50 ft when the images are for geoprocessing. Images obtained for inspection work may require manual focus.
- Once the shutter speed is adjusted, the exposure may be adjusted. The goal is to center the exposure value scale.
- Saving images for editing. RAW format saves more information than JPEG.
6.4.1.11 Multispectral and Hyperspectral Cameras
Multispectral and hyperspectral cameras are differentiated by the width and number of wavelength bands detected. Both cameras typically record reflected light in the red, green, and blue (RGB) as well as near-infrared. Some cameras have broader spectral ranges. From a practical perspective, the cameras are differentiated by spectral resolution, which is a combination of band width specificity and band number. Multispectral cameras typically collect data on three to nine relatively wide bands, while hyperspectral cameras suitable for small drones collect data on tens to hundreds of narrow bands.
Generally, multispectral cameras collect data in the near-infrared and red spectra. Some cameras also collect data in the blue and red-edge or other selected bands within wavelengths from 400 nm to 950 nm. While multispectral data can be collected by adding a filter to an RGB sensor, a camera specifically built to collect multispectral data has a dedicated sensor for each wavelength band collected. This design vastly increases the amount of data collected and increases the data-mining opportunities compared to cameras using filters. The multispectral camera is the dominant camera used in agriculture where resulting data are used to differentiate between healthy and diseased plants.
Hyperspectral cameras collect data on more bands than the multispectral camera, allowing for greater characterization of the area or items imaged. Some hyperspectral cameras can discern between certain minerals in the short wavelength infrared (SWIR) range from 1,000 to 2,500 nm. The camera can differentiate between healthy and diseased plants, as well as stages of plant growth, hydration status, the presence of herbaceous pests, plant varieties, and some nutritional deficiencies. Furthermore, these cameras can identify objects, materials, or physical processes not discerned by multispectral analysis (for example, mineral and surface chemical composition (see (GISGeography 2018)). The drawback of hyperspectral cameras versus multispectral cameras is cost. The hyperspectral camera is more expensive and the data-rich output makes analysis more complex and increases needed storage.
When using these cameras, vegetation appears green because chlorophyll absorbs red (630 nm to 680 nm) and blue wavelengths (450 nm to520 nm), leaving the green (520 nm to 600 nm) to be reflected. Reflectance at these three wavelengths is employed as a measure of active plant chlorophyll. A sick plant reflects more red and blue relative to green due to reduced photosynthesis. Accordingly, multispectral cameras capture relatively broad band of wavelengths in the RGB light. When vegetation is dense, the blue and red may be scattered and absorbed; an additional spectral range of the hyperspectral camera may help with characterization. The ratios of the NIR and red indicate plant biomass, general health, and hydration status. The cellular structure of vegetation causes infrared light (680 nm to 700 nm) to be reflected; this reflectance varies with plant cycle, season, climate, habitat, and other parameters (Adão et al. 2017). Stress and dead leaves significantly reduce near-infrared reflectance. The narrow near-infrared band (700 nm to 730 nm) marks a sudden change in reflectance from absorption of red to reflection of near infrared.
A multispectral camera can be used to obtain data that can serve as a baseline for monitoring plant health or implementing conservation or restoration efforts. Multispectral imaging supports parsing the ratio of reflected near-infrared radiation to red radiation. This allows the discernment of a unique spectral for different plants, which is rooted in the number of chloroplasts present in a plant leaf, the amount of active photosynthesis occurring, health status, nutritional status, or stage of growth. Specific known spectral reflectance curves can be used to identify various plant species.
The wavelengths that are typically used for hyperspectral imaging of plants range from UV (starting at about 250 nm) to SWIR (about 2500 nm). Cameras usually capture a certain subrange, such as the visible and near-infrared range (VIS–NIR, 400–1300 nm), SWIR (1300–2500 nm), or UV (250–400 nm). These ranges are combined in some sensors to increase the coverage of the spectrum. It is common to have more bands in a true multispectral image, perhaps including light in the infrared region (wavelength over 700 nm.) Additionally, a hyperspectral image typically contains hundreds of contiguous narrow wavelength bands over a spectral range. The approach produces a dense, information-rich color dataset with enough spatial resolution to have many hundreds of data points (pixels) per leaf.
If a release of a particular hazardous, toxic, or characteristic waste is known to impact plant health or stress vegetation, biasing sampling using either multispectral or hyperspectral data may be useful. Either is a significant improvement over the typical ground field survey that often result in the reported finding of “no stressed vegetation.” If plant health, vegetation cover, and plant species diversity are valid indicators of the presence of a release or the health of land, then a finding of “no stressed vegetation” would be improved by quantitatively measuring and objectively characterizing plant health using these cameras.
Finally, hyperspectral camera imagery is being used to monitor cyanobacteria blooms in fresh water. The camera can differentiate the reflected wavelength differences between chlorophyll a, contained by particular cyanobacteria, and chlorophyll b typical of plants and green algae.
6.4.1.12 Long-Wave Infrared (LWIR) Camera
LWIR cameras use a sensor to detect wavelengths above 10,000 nm, a range that is referred to as thermal infrared. These cameras are more expensive and have lower resolution than visible light cameras butcan be paired with them. Radiometric LWIR cameras provide a measured temperature value for each pixel; standard LWIR cameras provide approximate temperatures. LWIR cameras can be used to assess heat loss from sources such as buildings, infrastructure, people and animals, or seepage of landfill gases. Similarly, these cameras can be used to assess thermal properties of different substances like snow versus rock or timber (see the High-Resolution and Thermal Aerial Images Identify Mine Openings at an Abandoned Colorado Mine case study).
6.4.1.13 LiDAR
LiDAR tools can be used to measure the heights of objects and features on the ground with a high degree of accuracy. Practical applications are the ability to build a topological map through vegetation, generate highly accurate terrain mapping, and perform basic infrastructure inspections. For these applications, LiDAR uses near-infrared light (about 1,000 nm) to image objects. Pulses of laser light are used to measure distances; 4000 pulses per second is typical for a lower cost LiDAR but these values can be in the hundreds of thousands or even millions of pulses per second. When the laser light strikes an object, the light is reflected. A sensor detects the reflected laser light and records the time from the laser pulse to the received reflection. This value is converted into a distance, and these measured distances are combined point by point to produce a 3-D image called a point cloud. Each point is assigned a classification such as ground, water, vegetation, man-made object, and others. Classified point clouds are more easily manipulated because undesired features, such as vegetation, can be filtered out. The point clouds generated with LiDAR inherently do not include color information; however, some manufacturers merge color image data from a camera to colorize the point cloud. Additionally, laser data points are compared with the GPS locations of the drone and balanced against the systems on the drone that record pitch, roll, and heading. By integrating this information, site-specific features such as elevation models and ground contours can be constructed.
LiDAR tools offer a number of advantages over visual cameras:
- high accuracy
- small FOV (0.1 to 1 milliradian) for detailed mapping on a local scale
- large FOV for more complete relational maps
- all data is geo-referenced cover larger area per time
- less impacted by shadows and steep terrain
- large dataset to manipulate
- no external light source requried
Considerations for flight planning for LiDAR include:
- fying at night is possible (requires FAA waiver)
- increase overlap by 30 to 50% in steeper terrains
- run multiple passes in urban areas to transcend building shadows
- optimize flight elevation to specific LiDAR employed
6.4.2 Additional Information
- Cameras and settings for aerial surveys in the geosciences: optimizing image data (O'Connor, Smith, and James).
- Multi-Camera Imaging System for UAV Photogrammetry (Wierzbicki 2018).
- Geology 883, Remote Sensing Image Analysis and Application, Pennsylvania State University (PennState 2018).
- ESRI’s The ArcGIS Imagery Books (ESRI 2019).
- Digital terrain modeling: principles and methodology (Li, Zhu, and Gold 2005).
6.5 Photogrammetry
Software employing techniques such as georeferenced orthomosaics, point clouds, triangulated irregular network (TIN) meshes, digital elevation models (DEM), and digital terrain models (DTM) can extract 3-D information from 2-D images. Images with a high level of overlap taken from various positions, even without spatial orientation, can thus be used to generate 3-D models.
A typical work flow involves programming the drone to fly a series of flight lines back and forth over the subject, capturing images with overlap front to back and side to side. Overlap requirements vary depending on the site and mapping objectives, but, as a rule of thumb, at least 60% overlap is needed to reconstruct terrain maps with a high degree of accuracy. Subjects with vertical facades or geologic features not visible in straight down (Nadir) images can be reconstructed from photos taken at an angle that captures the facade. If a single structure is being captured, a series of circular orbits around the structure at two or more different altitudes are often combined with Nadir images. Most drone flight-planning software automatically calculates the flight lines, image intervals, and camera gimbal positions from a polygon or point of interest to support such image development.
These techniques work best for subjects with adequate contrast and stationary features. Water or featureless surfaces such as sand cannot be modeled because they lack sufficient contrast to match pictures. Movement creates distortion because the sensor reads out the image one line at a time rather than all at once. These rolling shutter or electronic shutter sensors can introduce distortion as the camera-subject relationship changes during a single photo. Using fast mechanical shutters and gimbals help to compensate for the lack of adequate contrast and movement.
6.5.1 Data Collection Design
Data management and sharing should be considered early in the development of a drone program. Proper data management leverages data collected from multiple sources and allows data to be easily located and shared. Data sharing can enhance safety and lower costs by reducing the need for redundant flights. A drone can collect gigabytes of data in a single flight. Information technology resources and GIS may not be prepared for the vast amount of resulting data; cloud-based computing and data storage should be considered in these instances.
6.5.2 Data Certification Requirements
Depending on the purpose of the georeferenced data, data generated from a drone flight should be verified by licensed professional surveyors or other professionals with mapping experience.
6.5.3 Data Visualization and Analysis
Software packages for data collected via drone include ENVI, ERDAS IMAGINE, ArcGIS, TNTMips, GRASS GIS, QGIS, and TerrSet. The programming languages R and Python have several libraries for processing remote sensing data. These programs can be used to build automated data processing chains and are required to use leading-edge machine learning tools (use of artificial intelligence (AI) to automatically learn and improve from experience) with remote sensing data. Selecting appropriate software packages should be based on project goals and future anticipated projects.
6.6 Sample Collection and Monitoring using Drones
Drones may be used to collect water, air, and soil samples, particularly samples that may be difficult or dangerous for a human to collect. The area of physical sample collection via drones is developing rapidly. The following sections focus on water sample collection as the architype physical sampling. Air sampling and, to a lesser degree, soil sampling applications are developing and are not extensively addressed.
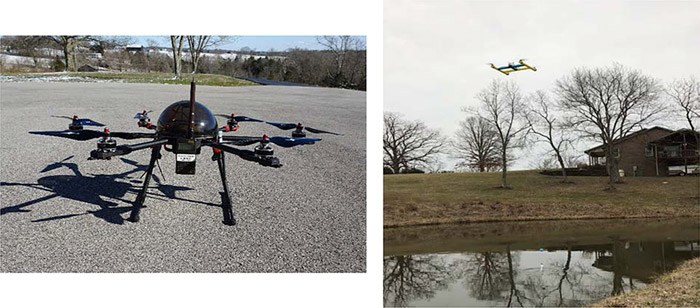
Figure 6‑3. Example drones.
Source: Photos courtesy of Kentucky Department of Transportation and the Division of Waste Management
The Kentucky Department of Transportation and the Division of Waste Management with the help of Ardupilot open source project built a hexacopter and quadrotor. The hexacopter, pictured in Figure 6‑3 (left), carries an air pump and sorbent tube to determine the potential presence of hazardous air pollution produced by fires. The quadrotor, pictured in Figure 6‑3 (right), collects a water sample using a double-valve bailer on a tether. The expanded polypropylene foam pool noodle frame material is light weight, which increases payload capacity, enables water landings, and minimizes propwash over the sample area.
6.6.1 Water Sampling Devices
Multiple water-sampling devices have been developed and demonstrated for drones (see Table 6‑2). In general, drone water-sampling devices fall into two categories: surface-water sampling devices, and deep-water sampling devices. Table 6‑2 provides a description of drone water sampling equipment cited in literature at the time of this writing. Many of these tools were developed by universities and may not be available for commercial deployment.
Ultimately, the best equipment for a given job satisfies the following criteria:
- Has it been tested and demonstrated to work?
- Is it commercially available for rent or purchase?
- Can it collect water samples from the required depths?
- Does it collect the required sample volume in one flight?
- Will regulators accept water samples collected with this method (see below)?
Table 6‑2. Description of sampling devices
| Reference | Sample volume | Sample depth | Description of sampling device |
|---|---|---|---|
| (Ore et al. 2015) | 20 mL | <1 m | 1-m-long tube with onboard pump |
| (Cornell, Herman, and Ontiveros 2016) | 50 mL | 0 m | Falcon tube dipped below surface |
| (Koparan et al. 2018) | 130 mL | 0.6-0.8 m | Thief-style, messenger-triggered bottle |
| (Terada et al. 2018) | 250 mL | <0.8 m | Sample tube with check-valve |
| (Washburn et al. 2018) | 500 mL | 5 m | Bottle closes autonomously at a specified pressure |
| (IRYS 2016) | 1000 mL | 0 m | Thin tray submerged in water |
| (Castendyk, Straight, and Filiatreault 2017) | 1250 mL | 80 m | Niskin sample bottle |
| (Williams et al. 2018) | 2000 mL | 83 m | Proprietary sampling device |
6.6.1.1 High-Lift-Capacity Drones
The drone used to collect water samples should be able to lift (1) the weight of the drone, (2) the weight of the water sampling device when filled with water, and (3), if applicable, the weight of specialized equipment added to the payload, such as a messenger and a messenger-release device. Small drones useful for photography may not have the lift needed.
6.6.1.2 Flight Distance and Power Supply
A drone loaded with a water sample may have a flight time of approximately 15 minutes. A margin of error should be added to this time to ensure the safe return of equipment. Given the time available and weight carried, drone flight range may be limited to 1,000 to 1,500 ft from take off to the sample point.
6.6.2 Quality Control
The ability to verify sampling depth is important. In the field, the water-sampling device is suspended at a known distance below the drone; thus, the elevation of the drone can be used to estimate the sample collection depth. Similarly, the tether holding the sampler can mark depth using brightly coloured tags placed at known intervals. Furthermore, if the water parameters are known, density, salinity, conductivity, and temperature may be used as indicators of depth. This approach requires consistency in these water parameters for the body of water at a specific depth and as measured by the device. Pressure may also be used to indicate depth; a small pressure transducer, such as a Van Essen, Micro-Diver, DI610 (approximately $1200) has a depth error of +/- 25 inches at 328 ft depth and provides a good measure of sample depth.
6.6.3 Advantages and Disadvantages
The advantages of water sampling using drones include the following:
- Improve safety by eliminating the need for humans to work on or near water. Standard practices for water sampling involve a person filling water bottles from a shoreline or from a boat. Working on or near water presents several risks to human health. In October 2017, a contractor drowned after falling into a coal-ash pond in Kentucky (See WDRB News article (WDRB 2017)). In addition to the obvious concern of drowning, some stratified basins can accumulate large quantities of dissolved gases (CO2, H2S, CH4), and rapid degassing events can displace atmospheric oxygen leading to asphyxiation or, in the case of hydrogen sulfide, cause acute toxicity.
- Reduce costs associated with water sampling (no need for a boat or an access road; fewer staff).
- Allow increased sampling frequency due to ease of sampling and reduced cost.
- Enable better water quality management because of better understanding of water quality and shorter response time to changes in water quality.
Drone water sampling has several disadvantages compared to boat-based practices. As the practice gains wider acceptance and regulatory approval, some of these disadvantages may be eliminated.
- Sample volume is limited due to the weight of a loaded water sampler.
- Sample depth is restrained by regulatory restrictions on drone height. Methods that involve suspending the sampler on a tether below the drone (Castendyk, Straight, and Filiatreault 2017); (Castendyk et al. 2018) are restricted to maximally 400 ft below the drone and sampling can only occur to a depth of the tether.
- Off-the-shelf equipment for drone water sampling is not widely available. One engineering firm sells water-sampling equipment (Hatch Associates Consultants, Mississauga, Canada). Interested companies either need to: (1) purchase their own specialized equipment, develop custom attachments, and train crew or (2) contract for this service.
- Drone water sampling is new and unfamiliar to regulators and the industry, leading to caution when adopting nonstandard techniques.
- Establishing legal approval to conduct drone water sampling may hinder its use.
6.6.3.1 Sample Locations
To collect representative water samples, the depth and surface area of the water body must be taken into account. Typically, water samples are collected from the point directly above the maximum depth of the water body. Assuming there are no lateral changes in water chemistry, sampling from this point should allow an assessment of the entire water body. Water bodies, such as, ponds and lakes having large surface areas or multiple floor depressions, or sub-basins, may require multiple sampling points. A bathymetry map, if available, shows the locations of depressions which may have a unique water chemistry characteristic as compared to the larger water body.
6.6.3.2 Number of Samples
Stratification may occur in the water column, resulting in discrete layers with different water chemistry. Stratification is caused by vertical density difference between shallow and deep water which result from surface water warming faster than deep water, high salinity water being added to the water body from surface or groundwater, or both. Sampling only the surface of a stratified water body can give a false indication of the overall water quality, especially if fresh rainwater has diluted the surface water layer relative to the deep layer. For this reason, the State of Nevada requires that mine pit lakes deeper than 25 ft be sampled at a minimum of three intervals: near the surface, in the middle, and near the bottom.
To appropriately characterize a water body, at least one water sample should be collected from each homogeneous layer. For shallow ponds less than ten ft deep, a single surface sample may be sufficient assuming that the water column is well mixed by wind energy. For water bodies deeper than 25 ft, this requires: (1) a water sampling device capable of collecting water samples from depth (see below), and (2) knowledge of the depth intervals of stratified layers within the body. To complicate matters, the depth of stratified layers changes seasonally, such that the appropriate sampling depths used during one site visit may be inappropriate on another site visit. Guessing the appropriate sample depths, without knowledge of water column, structure can result in missing an important layer. Over-sampling may result in chemically redundant samples.
To avoid these outcomes, it is best to profile the in situ physiochemical properties of the lake before sampling (Castendyk, Straight, and Filiatreault 2017); (Castendyk et al. 2018 ). One useful device for this purpose is YSI CastAway® CTD (approximate cost $6,500; (SonTek 2019)). The CastAway is a hand deployable conductivity, temperature, and depth instrument for hydrologic profiling. It measures in situ temperature, electrical conductivity and water density as a function of depth at five times per second during its decent and accent. The data set is sent to a laptop, and the associate software illustrates profiles of each variable. Such data can be used to identify homogeneous layers and to select sampling depths.
6.6.3.3 Sample Volume
To determine the volume of sample needed consider the following:
- What contaminants of concern need to be measured? For example, the suite of parameters listed on an applicable effluent discharge permit;
- Are both total and dissolved concentrations are required.
- Ask the receiving analytical laboratory for the number of water bottles needed to measure the suite of parameters and the volumes of each water bottle.
6.7 Cost Considerations
Companies throughout the U.S. offer product and support ranging from turn-key equipment packages to individual items or services such as hardware, software, postflight, image processing and analysis, data visualization, and pilot training. Most providers offer finished mapping and surveys, aerial imagery, and videography while slightly fewer companies provide multispectral, hyperspectral, infrared, LiDAR, or comparable services. Limited numbers of companies offer water and stack testing. Aerial imagery and videography are inexpensive and broadly useful such that companies are developing in-house expertise. The drone services market is continuously evolving and competitive such that new equipment and services arise almost continually.
Complete drone packages are readily available that include the unmanned aircraft vehicle (fixed wing or multirotor), camera (still and video), mission planning software for creating autonomous missions, and postprocessing and analytical software for generating orthoimagery, analyzing vegetative health, creating 3-D digital elevation and surface models, and calculating cut volumes or change-in elevations. Such systems are generally adapted for mapping surveys using photogrammetric methods. Prices for a simple camera drone and supporting software can be as low as about $1,000. More complex systems are usually in the range of $10,000 to more than $30,000.
6.8 Case Studies
- Drone Technology Expedites and Streamlines Site Characterization at a Former Golf Course in Missouri
- High-Resolution and Thermal Aerial Images Identify Mine Openings at an Abandoned Colorado Mine
- RPAS Collects Water Samples to Avoid Safety Concerns at Montana Tunnels Mine
Click here to download the entire document.

