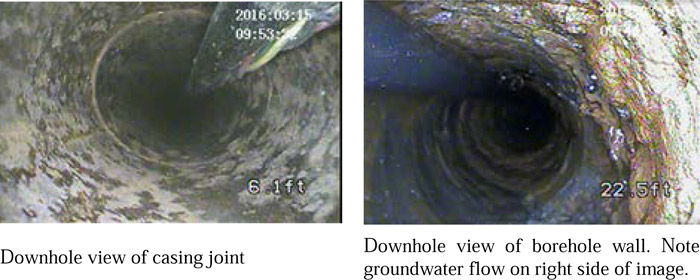
4 Borehole Geophysics
Borehole geophysical tools provide high-resolution geologic, hydrogeologic, and geochemical data that aid in developing robust CSMs. Borehole geophysics is best applied where direct sensing methods cannot be used (typically too dense or too deep). Certain borehole geophysical tools [nuclear magnetic resonance (NMR), natural gamma, induction] can be used in existing wells as a cost-effective alternative to drilling new borings or using direct sensing methods. Borehole geophysical tools can also provide data on parameters that cannot be obtained with direct sensing tools, such as porosity.
A wide variety of geophysical tools are available to provide information on soil and bedrock lithology porosity; permeability and hydraulic conductivity; pore-fluid characteristics; fracture characterization; well construction; and other hydrologic parameters such as hydraulic head, residual saturation, and dynamic flow conditions. Data are commonly acquired using wireline methods in open boreholes, although some geophysical tools can be deployed in cased wells. Some tools can be deployed in dry, open holes, but most require fluid in the borehole (water or drilling mud) to transmit and collect data or are specifically designed to characterize fluid within the formation.
Borehole geophysical tools have been applied for decades to improve site characterization but are generally underused due to lack of understanding or awareness. The tools presented in this document can provide information concerning the physical (lithology), hydraulic (flow velocity), and chemical (dissolved solids) aspects of the subsurface. Borehole geophysics can provide relatively quick subsurface information without significant costs. Typically, a suite of tools is deployed either at once or in sequence, and the results of each are integrated to infer subsurface characteristics. Combinations of tools (See USGS Fractured Rock Geophysical Toolbox Method Selection Tool (USGS 2018b)) are appropriate for particular geologic environments and to describe the particular geologic properties that affect contaminant distribution and transport and fate and that inform decisions regarding remedial approaches.
4.1 How to Select and Apply Borehole Geophysical Tools Using this Document
Preparing a borehole geophysical tool logging program includes identifying the key project parameters and objectives, selecting the most appropriate geophysical tools, and communicating with the geophysicist. Before selecting a borehole geophysical tool, it is important to understand the parameters the tool can measure and the site-specific conditions the tool requires to acquire the data. Borehole geophysical tools described in this section are as follows: fluid temperature, fluid resistivity, mechanical caliper, optical and acoustic televiewers, natural gamma, borehole flow meters (heat-pulse flow meter and the flow impeller), and advanced borehole logging (electric resistivity, NMR, and borehole video).
The borehole geophysical program development and tool selection should consider the following:
- Project and data quality objectives
- Local and regional geology
- Site-specific logging logistics
- Drilling methods
- Anticipated borehole conditions
- Log analysis
- Cost
The tools presented in this section are summarized in Table 4‑1. The project geophysicist may use various orders of deployment. Other factors such as cost, time, tool availability, or initial knowledge of rock type may mean certain tools are not necessary.
Table 4‑1. Borehole logging tools discussed
| Logging Tool | Primary Application |
|---|---|
| Fluid Temperature | Records borehole temperature |
| Fluid Resistivity (or Conductivity) | Measures electrical resistance of borehole fluids |
| Mechanical Caliper | Measures borehole diameter |
| Optical Televiewer (OTV) | Optical image of borehole walls |
| Acoustic Televiewer (ATV) | Acoustical image of borehole wall |
| Natural Gamma | Measures gamma radiation emitted from formation |
In this guidance, each tool section includes a discussion of what the tool tells you, how it works, variations, benefits, appropriate use, limitations (both technical and nontechnical), data collection design, quality controls, data interpretation and presentation (including data extrapolations and misuse), which tools can be used together, costs, and references. The ASCT Borehole Geophysical Tool Summary Table provides a screening process based on site and project parameters and objectives. More than one tool may provide the data required. By using different tools to collect similar data, supporting evidence is provided and data confidence for site characterization is improved. ASCT Borehole Geophysics Checklists (.xlsx version) are provided to support tool selection and use and project management.
4.1.1 Tool Availability
Almost all borehole geophysical investigations involve the application of multiple tools, most of which are readily available. Less commonly used tools (for example, magnetic susceptibility) may require extra coordination with the geophysicist to confirm tool availability and application, for example. It is critical to communicate with the geophysical contractor or operator to ensure project objectives are met, data of known quality is collected, and an accurate schedule and cost is received. Critical site information must be provided to the geophysicist, such as geology, depth to groundwater, borehole conditions, estimated logging footage, field schedule, and site accessibility.
4.1.2 Data Collection Design
Data collection and reporting are important components of geophysical logging programs. Data acquisition and processing are typically provided by a geophysical contractor or qualified practitioners that can purchase or rent the necessary equipment and perform the work themselves. Data processing includes establishing a set datum for depth or elevation matching between geophysical logs, correcting borehole effects, converting log measurements to parameters of interest, and merging logs into a presentable format. A geophysical contractor may not provide data analysis and interpretation unless explicitly requested during the proposal process. Hence, it is important to discuss expectations prior to initiating work so that budgets can be adjusted accordingly.
To effectively communicate with the geophysicist on appropriate tool selection and ensure quality data are collected in a cost-effective manner that meet the project objectives, a good basic understanding of each tool’s physical limitations, data processing methods and limitations, and data analytical methods is recommended.
Borehole logging by field personnel is subjective and may vary depending on the skill and experience of personnel. Borehole geophysical logs are typically generated from continuously acquired, objective, and repeatable data from which desired parameters can be qualitatively or quantitatively derived. Geophysical logs provide a significant amount of high-resolution data on lithology, hydrogeologic parameters, and pore fluid characteristics in or near the borehole. While these borehole logs represent detailed vertical interpretations, they must be compared to other borehole logs to provide a planar or horizontal interpretation that can potentially be extrapolated across the site. Multiple parameters can be measured using different tools and the results validated using multiple lines of evidence along with other investigative data for site interpretation.
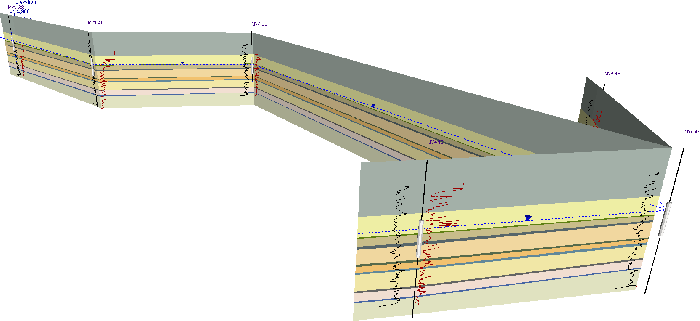
Borehole geophysical logs can be correlated between multiple borehole locations, providing stratigraphic and structural information. This correlation allows the overall geologic framework to be portrayed in 2-D and 3-D representations (see Figure 4‑1 and Figure 4‑2). These tools can identify and quantify various bedrock structural features, such as formation contacts and fracture location and orientation. These data can then be correlated between wells. In sediments and sedimentary bedrock, the correlation process uses characteristic curve matching and relies on principles of stratigraphy and sedimentary depositional processes such as Original Horizontality and Walther’s Law. These principles state that stratigraphic facies and facies sequences commonly display characteristic compositional and textural changes in the vertical profile that can be observed on geophysical logs and correlated over distances between logs. Once the various facies or facies sequences are identified and correlated, intervals of interest (such as fluid transport pathways) can be assessed.
Figure 4‑1. View of the overall geologic framework using 2-D representation.
Source: ERM, Used with permission
Figure 4‑2. View of the overall geologic framework using 3-D representation.
Source: ERM, Used with permission
Whether in sediments or bedrock, the spacing of log data dictates the ability to resolve and correlate features of interest. At the local level and where closely spaced geophysical logs are available, correlating individual stratigraphic or structural features is usually feasible. For projects where geophysical logs represent locations that are several hundred ft or more apart, only larger-scale features that are laterally continuous are generally able to be correlated. A critical part of data acquisition planning is understanding the spacing needed to resolve and characterize geologic features of interest based on the conceptual model for the local geology.
4.1.3 Technical Advantages and General Limitations of Fundamental Logging Tools
The suite of fundamental borehole logging tools highlights a comprehensive set of tools intended to enhance characterization of bedrock and fractured rock systems. All of these tools are widely available for use by qualified geophysicists and logging personnel. Many of these tools are readily deployed during a days’ worth of logging and do not involve significant independent costs beyond daily rates offered by many specialty providers. Key technical advantages of these tools include the following:
- Postprocessed data offer a visually familiar record understood by many.
- High-resolution data are easily and rapidly obtained at sub-cm (or lower) accuracy.
- Use of these tools supplements and may even replace the need for rock-core collection and visual logging during bedrock characterizations.
- Downhole tooling and surface cables allow the rapid interchange of probes, sondes, and detectors during logging.
- Select tools can be deployed in both cased and uncased hole settings, which can be advantageous at some sites,
- The combination of tools collectively supports lithologic and structural determinations of bedrock conditions.
- Iterative deployment of tools provides detailed information that assists in the interpretations of other logs, for instance, use of the caliper tool assesses borehole diameter in advance of gamma logging.
- Under certain circumstances, key information may be obtained across air-filled zones.
- Several of the tools provide a useful first step toward determining flow into or out of the borehole independently of more detailed borehole flow-meter assessments.
While there are inherently more technical advantages associated with the fundamental borehole logging tools described herein, a few notable limitations that should be considered when planning a borehole investigation program or interpreting logs. These general limitations include:
- Select tools require the borehole to be at equilibrium with removal of drilling fluids and residual groundwater prior to logging. In addition, image quality may be compromised with turbid fluids.
- Inadvertent damage to sensitive probes or potential drag-down of contaminants can result from the presence of residual NAPL.
- Well pumps, cables, and other potential infrastructure requires removal to allow tools to be lowered and raised in a borehole.
- Certain tools require use of centralizers, which may present a challenge with irregular borehole wall conditions.
- Poor well construction can cause degradation of image and data quality.
4.1.4 Case Studies
An example of how these individual tools were used to develop a CSM is provided in the following case study:
4.2 Fluid Temperature
Fluid-temperature logging involves using a downhole probe to continuously record the temperature of fluids in a borehole. During logging, a probe is incrementally lowered to directly measure changes in temperature using a thermistor or platinum sensor to estimate geothermal gradients of groundwater or other fluids in direct contact with the probe. Temperature logging is most commonly used in fluid-filled bedrock boreholes to assess flow into or out of the borehole. In some instances, fluid-temperature logging has been used in dry boreholes or discrete borehole zones devoid of fluids to indirectly measure formation temperature. During field application, fluid temperature is routinely logged concurrently with fluid resistivity based on the current configuration of most commercially available tools that combines both tools on the same sonde. Refer to Section 4.3 for a description of the fluid-resistivity tool.
A continuous profile of borehole temperature is also a useful first step prior to deploying a borehole flow meter to identify potential zones of flow into or out of a borehole (see Section 4.8).
4.2.1 Use and Application
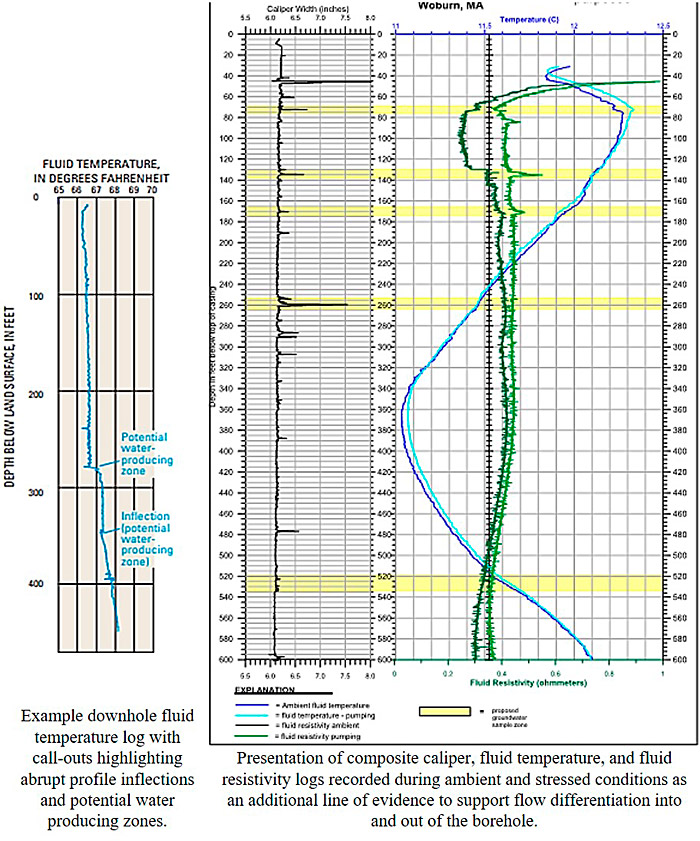
Fluid-temperature logging helps quantify geothermal changes and assess the flow of groundwater within a borehole (See Figure 4‑3). The tooling is easily deployable using a downhole winch, pulley system, and depth encoder to determine vertical accuracy. To minimize fluid disturbance while the borehole is at equilibrium, the tool should be lowered, rather than raised, while gathering data.
Abrupt changes in fluid temperature may correspond with zones with a discrete inflow or outflow of water from the borehole. Plotting the continuous-temperature profile as one track or strip along with results and data from other conventional logging tools corroborates interpretations using multiple lines of evidence.
Estimating zones of where fluid flow is subsequently used during the characterization process to refine discrete vertical zones where more detailed flow measurements are needed. Additionally, logging can occur while the borehole is under stress by pumping to potentially enhance water-bearing zone identification.
Figure 4‑3. Examples of downhole fluid temperature log and composite logs.
Source: Left – Borehole Geophysical Logging of Water-Supply Wells in the Piedmont, Blue Ridge, and Valley and Ridge, Georgia (USGS 2007) and Right – Woodard & Curran, Used with permission
4.2.2 Data Collection Design
Fluid-temperature logging is typically one of the first tools to be used in borehole logging. Because temperature logging generally occurs downward in a borehole, fluid-temperature logging is performed prior to using tools that are logged upward to minimize water-column disturbance.
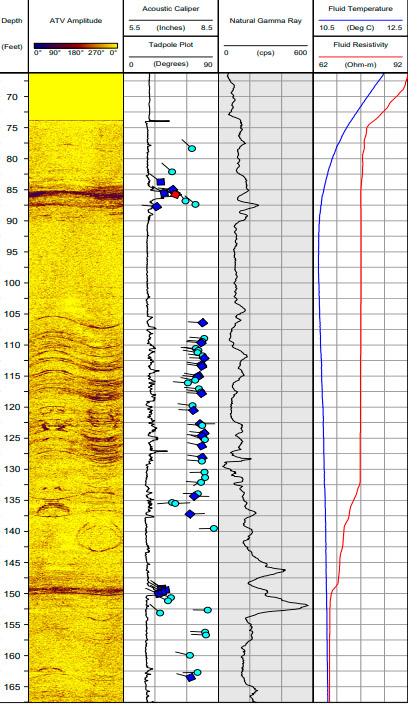
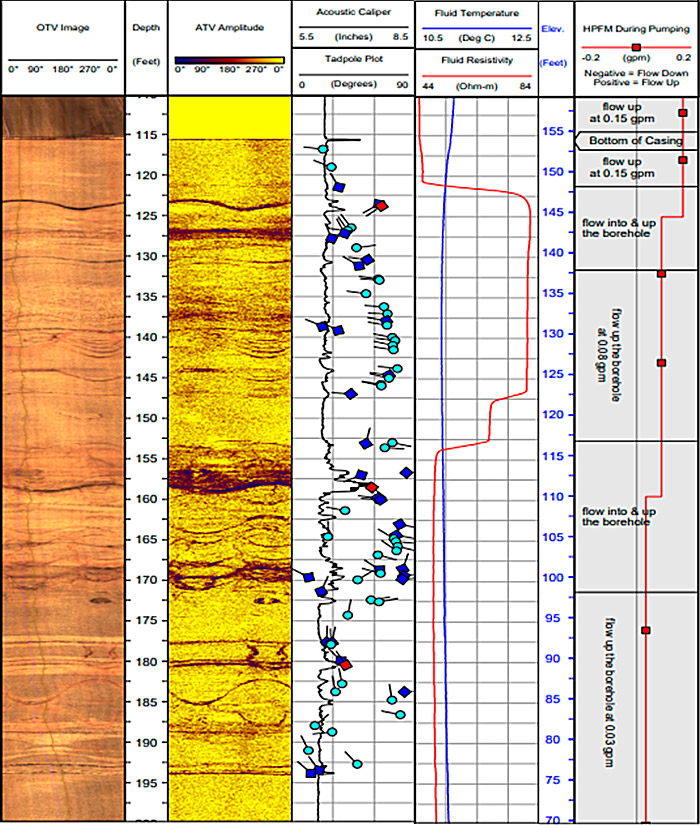
Figure 4‑4. Example composite log of fluid temperature (blue line) along with fluid resistivity (red line), natural gamma, acoustic, acoustic caliper, and tadpole plots used to denote structural orientation of planar features.
Source: Image adapted from borehole geophysical logs included in the Remedial Investigation Report for the Savage Municipal Water Supply Superfund Site, Milford, NH, prepared by Weston Solutions Inc., March 2014), Used with permission
4.2.3 Log Intepretation
Fluid-temperature logs provide an index of temperatures in a borehole. Groundwater temperatures often vary based on flow conditions and small-scale changes are a useful indicator to assess inflections on a downhole basis. The sub-mm accuracy of temperature logging may be used to estimate where flow is occurring when corroborated by similar deviations in other logs and borehole wall images identifying planar and subplanar features that suggest fracture locations.
Figure 4‑4 provides an example composite log of fluid temperature (blue line) along with fluid resistivity (red line), natural gamma, ATV (borehole image developed from ultrasonic frequency), acoustic caliper (application of ATV travel times to generate acoustic borehole log based on borehole diameter), and tadpole plots used to denote structural orientation of planar features.
4.3 Fluid Resistivity
Fluid-resistivity logging uses a downhole probe to continuously record the electrical resistance of the fluid in a borehole using a series of electrodes. The downhole resistivity sounding incorporates multiple electrodes for real-time measurement. The electrodes are configured in a stacked array to minimize interferences during logging. Based on interpretations of the generated fluid-resistivity logging profile, areas of inflow or outflow from the borehole are differentiated and then corroborated by changes in fluid temperature, caliper measurements, and other geophysical logs.
Fluid resistivity notably is the inverse of fluid conductance or fluid conductivity[1] and provides a record of changes in the dissolved-solids concentration measured as ohm-meters (Ωm). Many of the tools currently in use have reverted to logging fluid conductivity; it is important to establish the preferred convention prior to logging. Many practitioners prefer to retain the convention of expressing logging results as fluid conductivity for consistency with direct-instrument reading (if such a tool is employed). Expressing logging results as fluid conductivity is also preferred for comparison with other direct-read multiparameter instruments used during groundwater investigations where specific conductivity is measured prior to groundwater sample collection.
4.3.1 Use and Application
Electrical current flow within a formation is governed primarily by fluid-filled pore spaces and the relationship of pore interconnectivity, volume, fluid composition, and temperature. Formation lithology also affects resistivity properties based on mineralogic assemblage and geochemical changes resulting from hydrothermal alteration. The interrelationship of these formation properties and the general ease of fluid-resistivity logging using conventional and commercially available tools has led to resistivity logging in support of various applications, including mineral explorations, oil and gas evaluations, and hydrogeologic assessments. Similarly, due to the strong dependence of fluid resistivity on the presence of dissolved solids, logging is often used to evaluate salt water and fresh water interaction in coastal aquifers.
Fluid-resistivity logging is conducted in fluid-filled open boreholes. Prior to fluid resisitivity logging, the borehole should be flushed of drilling fluids and/or borehole fluid additives and given time to equilibrate. Fluid resistivity logging can also be conducted while the borehole is under stress from pumping to facilitate identification of intervals where water is entering the borehole.
Fluid resistivity is commonly logged concurrently with temperature as an additional line of evidence to delineate water-bearing zones and identify predominant vertical flow conditions within a borehole. This parameter is generally recorded earlier in the logging process to gain a relative understanding of flow in and out of the borehole before the water column has been disturbed by other logging tools. Downhole resistivity probes are typically combined with a temperature thermistor in one probe.
4.3.2 Data Collection Design
Fluid-resistivity logging is conducted using wireline methods in a similar manner as most other borehole geophysical logging tools and must be acquired in open, fluid-filled boreholes. Resistivity logs measure the electrical resistivity that is affected by a number of factors, including include temperature, drilling-fluid resistivity, borehole diameter, mud cake, and drilling-fluid invasion. To use resistivity logs for quantitative analyses, these factors must be documented during logging and recorded in the log headings so they can be factored into the evaluation of the data.
The requirement for open, fluid-filled boreholes means that geophysical logging must be conducted soon after the borehole has reached terminal depth and has been stabilized by the driller. To minimize costs for standby time, communication and coordination with the geophysical service provider is required. Fluid-resistivity logging should be performed early in the logging process along with other primary tools (caliper and fluid temperature) to capture the static and undisturbed state of the borehole.
As with other borehole geophysical tools, logging at a single location provides parameter data only in the immediate vicinity of that location. By logging multiple locations, data can be correlated over greater distances and provide 2-D (cross-sectional) and 3-D conceptual models. The density of well locations to be logged should be based on the stratigraphic framework and the nature of features that the investigation is attempting to resolve.
4.3.3 Data Interpretation and Presentation
Resistivity log data is usually processed and can be displayed in real-time. An example log is provided in Figure 4‑5, along with a subset of key geophysical logging parameters. The dashed oval in the figure highlights the fluid-resistivity deviation that occurs above a notable fracture at approximately 158 ft and concurrent with a change in flow in the heat-pulse flow meter (HPFM) log.
Figure 4‑5. Example borehole log including optical/acoustic televiewer, inferred structural characteristics (tadpole plots), fluid temperature (blue line), fluid resistivity (red line), and stressed HPFM measurements.
Source: Image adapted from borehole geophysical logs included in the Remedial Investigation Report for the Savage Municipal Water Supply Superfund Site, Milford, NH, prepared by Weston Solutions Inc., March 2014), Used with permission
4.4 Mechanical Caliper
A mechanical caliper tool provides a vertical profile of borehole diameter often using either a three-armed or four-armed device. During field application, the caliper is lowered to the bottom of the borehole (or lowest desired depth of measurement) and the arms are opened via direct connection to a laptop computer and pulled upward at a steady rate to record data. The spring-loaded arms reach outward against the edges of the borehole wall and the distance from each arm is recorded on the laptop computer in real-time. The total spacing from each arm is aggregated to determine average borehole diameter on a depth basis.
4.4.1 Use and Application
Mechanical calipers are effective at identifying voids, fractures, and similar openings in borehole walls, but cannot provide information on the orientation or lateral extent of such features. For this reason, the mechanical caliper is commonly used to identify vertical zones where enlargement has occurred. These zones are qualitatively interpreted as intervals where fractures may be present, alterations of the formation along the borehole wall that occurred during drilling, or lithologic and depositional voids.
Calipers are also effective, with or without corollary downhole tools, in locating the bottom of well casings, confirming drill casing diameter, and identifying casing breaks.
4.4.2 Data Collection Design
Caliper logging is often amongst the first of the geophysical tools to be deployed because of its durability and lower cost compared to video, electrical, or acoustic tools. Caliper logging is performed upward from the bottom of the borehole to the ground surface. As noted below, caliper logs are typically presented with other output to readily compare borehole features. The tool can be deployed independently, thus, it can be run at any time during the downhole investigation.
4.4.3 Log Interpretation
A caliper log often includes a corresponding geologic section to demonstrate the possible or likely caliper responses to given strata. Most data interpretation is performed with other standard downhole tool outputs, including natural gamma, fluid temperature, fluid resistivity and electrical logs. Aligning complimentary log outputs supports the multiple lines of evidence approach emphasized by correlating individual strip logs. When interpreting caliper logs, borehole-diameter deviations alone may not be indicative of fluid flow; therefore, correlation with other logs, notably fluid temperature or resistivity, is required to identify flow into or out of a borehole.
4.5 Optical Televiewer
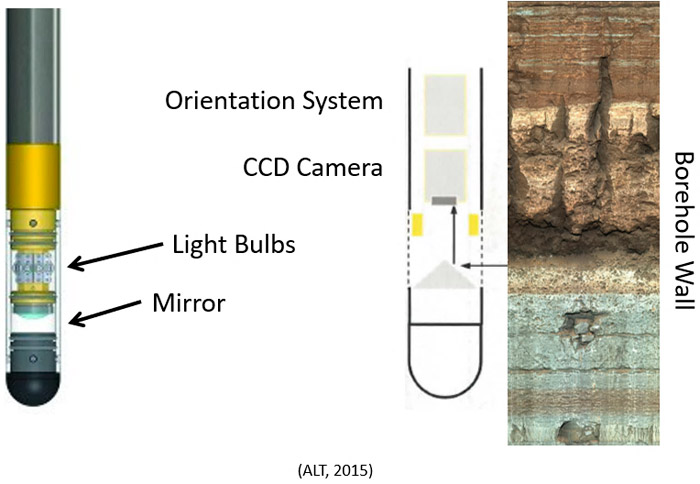
The OTV collects a series of ring-shaped optical images at closely spaced discrete vertical spacings as the tool is moved vertically along the path of the borehole (see Figure 4‑6). Coincident with OTV data acquisition, data are collected by orientation sensors (a magnetometer and accelerometers) within the tool. Acquisition and processing software are used with data from these orientation sensors to produce accurate, precisely oriented, cylindrical images of the borehole (see Section 4.6.4). The OTV results in a familiar photographic image, as shown in the figure below, which many practitioners refer to as an image log or virtual core.
Figure 4‑6. Optical televiewer.
Source: Mount Sopris Instruments, Used with permission
The OTV and ATV (discussed in Section 4.6) probes are used during borehole investigations to produce vertically continuous, static images representing conditions at the borehole wall and cased interval in a well.
4.5.1 Use and Application
The OTV tool can be deployed in air- or water-filled open boreholes to assess consolidated formations or in wells completed with screen and casing to evaluate the general condition of the well. The OTV provides a photographic image that is used to assess formation properties such as stratigraphic bedding, contrasting lithologies, and geologic contacts. Fractures are often easily discernable and can reflect regional interpretations involving joints or faults as well as washed out or karstic zones. OTV logs may provide an indicator of groundwater flow within a borehole based on evidence of oxidative staining. If the borehole has been impacted by NAPL, stains or residues from these contaminants may also be observed.
4.5.2 Data Collection Design
The quality of OTV data obtained within the water-filled portion of the hole varies significantly with turbidity. As such, logging should be planned to allow time for suspended materials to settle following disturbances resulting from drilling activities or pump removal.
Chemical precipitation and biological growth may obscure features on the borehole wall; therefore, redevelopment may be appropriate to ensure the best possible image quality in older wells.
In situations where the hole is first cored and subsequently reamed, the smaller-diameter core hole may provide a better OTV (or ATV) image, depending on many factors including lithology and drilling characteristics. In some circumstances (such as soft rocks that may be eroded by drilling-fluid movement during coring), a rapidly drilled air-rotary hole yields a smoother borehole and a superior image. Consulting with the geophysical logging and drilling contractors during project planning can help identify the best approach at a particular site.
OTV logging speed is dependent on the selected vertical and horizontal resolution and the system design and cable type. Typical logging speeds for early-generation OTV systems were on the order of 1 m/min (3.3 ft/min) (Williams and Johnson 2004), while the latest generation of tools can be run at 2 m/min to 5 m/min (6.6 ft/min to 18 ft/min) or higher (ALT 2015).
Color calibration can be achieved using calibration kits supplied by the manufacturer of the OTV probe. The magnetometer and accelerometers are factory calibrated. Field checks on the magnetometer can be made using a compass and oriented cylinder (Williams and Johnson 2004).
4.5.3 Log Interpretation
Structural interpretations generated based upon OTV (and ATV logs) are sensitive to conditions such as borehole deviation and variations in diameter. Borehole deviation, the departure of the borehole from vertical (measured in degrees), and the concepts of apparent dip vs. true dip are illustrated in Figure 4‑7. Obviously, a probe run in a deviated borehole does not provide accurate dip (relative to horizontal); therefore, during log processing, deviation measurements collected by orientation sensors within the OTV (and ATV) probe should be used.
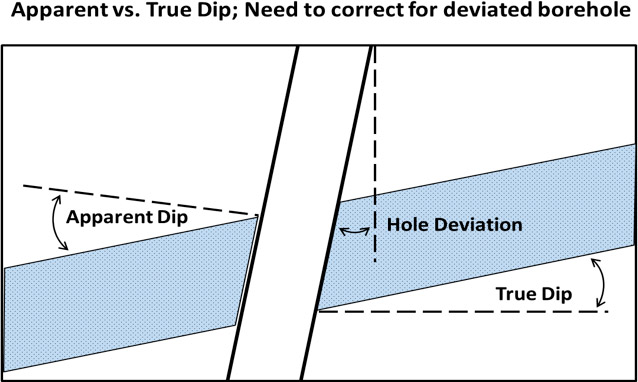
Figure 4‑7. Illustration of concepts of apparent dip vs. true dip.
Source: (Peterson 2017), Used with permission
4.6 Acoustic Televiewer
The ATV uses pulses of ultrasonic acoustic energy to generate an image of the borehole wall. A fixed transducer creates high-speed pulses that are directed to a rotating surface or acoustic mirror within the probe. Energy reflected off the mirror travels through the borehole fluid to the borehole wall. Some of the energy reflects back to the mirror and is reflected to a transducer, where it is detected (see Figure 4‑8). For each reflected pulse, the amplitude and travel time are recorded. Amplitude is a measure of energy retained in the returning pulse; low amplitudes indicate loss of energy at the borehole wall as a result of soft or fractured rock. Higher amplitudes suggest harder, unfractured rock. Travel time is proportional to distance traveled by the acoustic pulse; where the borehole fluid density is known, borehole diameter can be accurately determined and an acoustic caliper log generated.
The ATV collects up to 360 pairs of amplitude and travel time measurements in each circumferential scan as the tool is moved vertically along the path of the borehole. The vertical spacing between scans is dependent upon tool speed inside the borehole; acquisition software guides selection of logging speed to provide optimal horizontal to vertical resolution. As with the OTV, data are collected by orientation sensors (a magnetometer and accelerometers) within the tool. Acquisition and processing software are used with data from the orientation sensors and the transducer to produce accurate, precisely oriented cylindrical images of the amplitude and travel time (see Section 4.6.4).
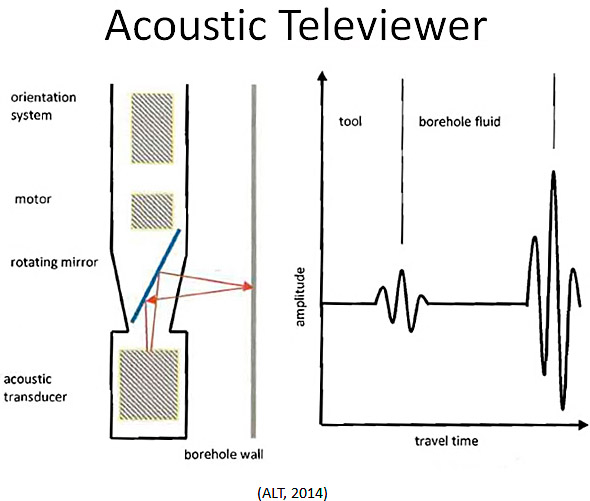
Figure 4‑8. Acoustic televiewer.
Source: Mount Sopris Instruments, Used with permission
4.6.1 Use and Application
The ATV is deployed within fluid-filled portions of boreholes, where the fluid (water or drilling mud) transmits the acoustic energy needed to generate the borehole record. The ATV is most commonly used in open boreholes where it is used to assess competent, consolidated formations and provide acoustic caliper and virtual core logs. In addition to the basic elements used for other geophysical logging (winch and wireline, data acquisition unit, field computer with monitor), metal- or plastic-band centralizers are installed on the probe to guide the probe along the central axis of the borehole to maintain consistent proportionality. Use of centralizers also on the tools helps provide accurate estimates regarding the strike and dip of planar and subplanar features. With appropriate processing, the ATV may also be used to evaluate the thickness and corrosion of the steel casing and to assess less competent consolidated formations prone to collapse when a centralized polyvinyl chloride (PVC) liner is emplaced within the borehole. ATV logs are also routinely used to assess casing or well screen conditions.
Consistent with the OTV, the ATV provides an image-based output of the borehole wall that is used to interpret stratigraphy, lithology, and the presence of geologic contacts. Evidence of subsurface fracturing as well as washed out zones in karst environmentas is also possible based on acoustical differences across void spaces.
4.6.2 Data Collection Design
A key comsideration during ATV deployment is the project requriements for vertical and horizontal resolution of the borehole image; this resolution is greatly dependent on logging speed. Typical logging speeds for early-generation ATV systems were on the order of 1 m/min (Williams and Johnson 2004); the latest generation of tools can be run at 2 m/min to 5 m/min or higher (ALT 2015). Acquisition software should be used to evaluate and adjust logging speed as logging proceeds.
Prior to initiating ATV logging, factors such as the borehole fluid type and level as well as the borehole condition should be considered. In general, a better ATV record is obtained in a borehole filled with water instead of drilling mud, so flushing the hole clean before logging may be desirable. Also, adding water to the borehole may allow portions of the borehole above the static water level to be logged, especially for hole completed in low-transmissivity units.
Probe centralization is especially important for good-quality image data and accurate structure orientation during ATV logging. Decentralization on ATV images is indicated by vertically striped transit-time and amplitude images, as shown on Figure 4‑9. Adjustable centralizers should be deployed based upon inspection of a mechanical caliper log. Using adjustable centralizers provides a more direct representation of actual borehole diameter compared to the nominal diameter of the tool used during borehole advancement.
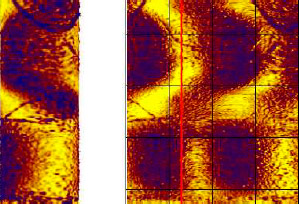
Figure 4‑9. Decentralized acoustic image.
Magnetometer and accelerometers are used to provide data on tool orientation during logging. The magnetometer and accelerometers are factory calibrated. Field checks on the magnetometer, however, can be made using a compass and oriented cylinder (Williams and Johnson 2004).
It is important to note that the presence of the steel casing interferes with image orientation. (Williams and Johnson 2004) noted that imaging in a fractured-rock aquifer borehole just below the base of steel surfacing casing is important. Because the magnetometer is affected by steel casing, the interval between the steel casing and borehole plus some overlap should be rerun with the magnetometer turned off. Then the rerun image is matched and spliced into the oriented image for the rest of the borehole.
4.6.3 Log Interpretation
ATV logs are postprocessed using specialty software to quantify the orientation of features identified on the recorded image. The precise orientations of planar features (for example, fractures, sedimentary bedding) identified by the log analyst may be determined and presented in a variety of formats.
To facilitate structural analysis (see Section 4.6.4), the cylindrical image is presented in an unrolled format, cut vertically at North (true or magnetic) and rolled out from left to right, often with vertical lines representing N (at the left), E, S, W, and N (again at the right). In this format, planar features such as fractures intersecting the borehole wall, follow sinusoidal traces, as shown in Figure 4‑10.
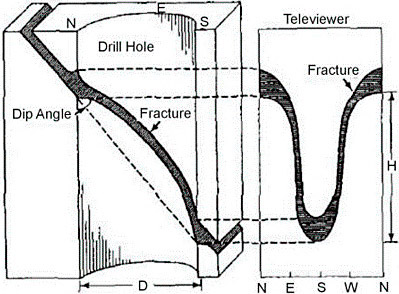
Figure 4‑10. Planar features such as fractures intersecting the borehole wall follow sinusoidal traces.
Source: (USACE 1995), Figure 7-30
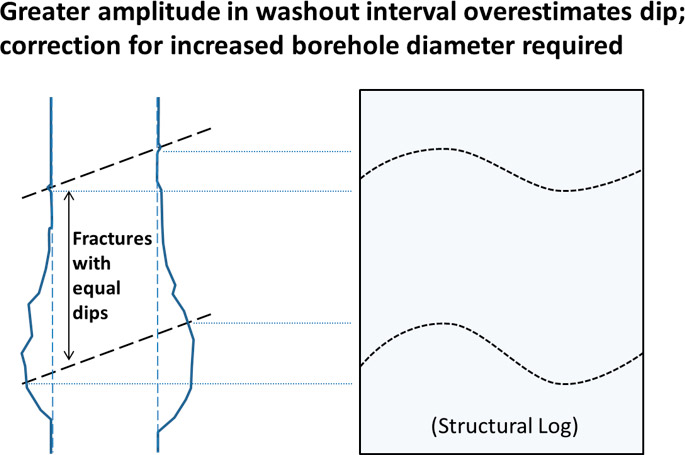
Structural interpretations generated based upon ATV (and OTV logs) are sensitive to conditions such as borehole deviation and variations in diameter, previously summarized in Figure 4‑7. As illustrated in Figure 4‑11, where planar features intersect a portion of the borehole with an enlarged diameter, a correspondingly higher-amplitude feature trace results on the sinusoidal structure plot. As a result, if corrections are not made to properly account for the off-gauge condition of the borehole, dips will always be overstated through caving or soft-rock intervals where the hole diameter is enlarged. Experience shows that even a 1-inch enlargement of hole diameter can result in overstatement of dip by several degrees, which is further supported by trigonometric principles. The correction requires reference to a continuous log of borehole diameter (mechanical or acoustic caliper); therefore, either mechanical caliper or ATV logs should also be run when OTV is used to evaluate structure.
Figure 4‑11. Illustration of greater amplitude in washout interval overestimates dip; correction for increased borehole diameter.
Source: (Peterson 2017), Used with permission
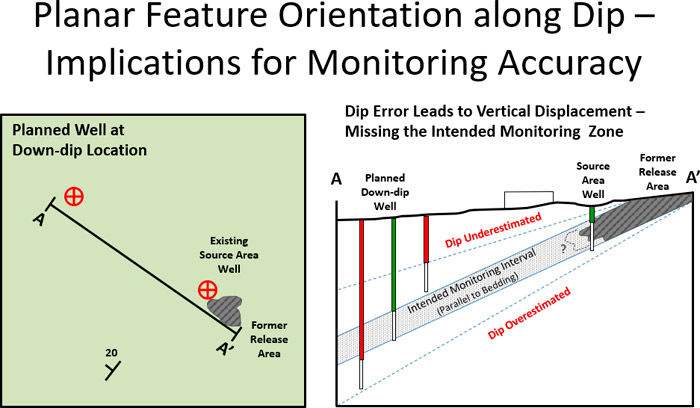
While somewhat time consuming, employing these corrections during log processing is necessary to provide results that are accurate and comparable between locations at a site. While the incremental accuracy provided may seem minor, common uses of geophysical logging data imply otherwise. As shown in the down-dip well siting example illustrated in Figure 4‑12, dip error as small as 1 degree can result in a typical (10-foot long) monitoring well screen being placed incorrectly, missing the intended monitoring zone. With >5 ft of error in vertical placement, a fracture meant to be located midscreen would be entirely missed at the down-dip location. Therefore, when procuring geophysical logging services, service providers should present the steps that are taken to ensure data quality.
Figure 4‑12. Down-dip well siting example (left); planar feature orientation along dip and implications for monitoring accuracy (right).
Source: (Peterson 2017), Used with permission
4.6.4 Virtual-Core Presentation of OTV and ATV Logs
As previously indicated, OTV and ATV probes include orientation sensors (magnetometer and accelerometer) to translate borehole wall images into a 360°, wrapped image referred to as a virtual core. This presentation format provides a consolidated and simplified image of conditions that are useful during log interpretation. Similarly, advances in postprocessing software used to develop virtual cores also allow these logs to be presented adjacent to strip logs from other tools. This section outlines the technical complexity associated with translating borehole images into 2-D projections and key details about presenting structural information.
4.6.4.1 Uninterpreted Data
Using processing software, oriented, uninterpreted image logging data can be presented in several formats, each represented as a single column on the well log. These include the unrolled, virtual-core, and slab-core logs. The unrolled format (see Figure 4‑13) shows the borehole image, cut vertically at North (true or magnetic) and rolled out from left to right, often with vertical lines representing N (at the left), E, S, W, and N (again at the right). In this format, planar features such as fractures intersecting the borehole wall follow sinusoidal traces. During interpretation (discussed subsequently), these traces allow the log analyst to determine the attitude (orientation) of the planar features. The low point of the sinusoid corresponds to the compass direction (azimuth) of the dip for the planar feature, while the amplitude (peak to trough distance) is directly proportional to the magnitude of the dip.
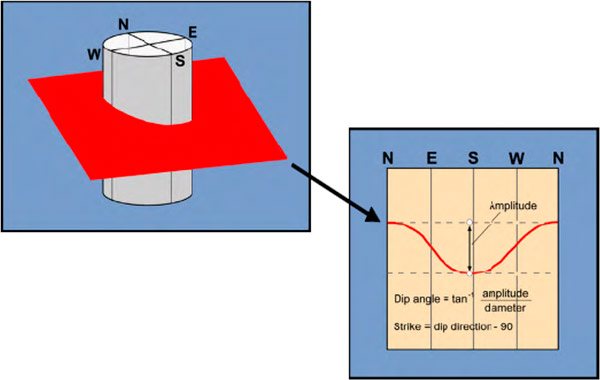
Figure 4‑13. Unrolled format shows the borehole image, cut vertically at North and rolled out from left to right, often with vertical lines representing N (at the left), E, S, W, and N (again at the right).
Source: (Weston 2014)
The virtual-core format for OTV or ATV provides a pseudo-3-D view of the borehole as viewed externally. When viewed in the processing software, the core-like image may be rotated to view from all directions. The slab-core format depicts features evident on the viewed side of the borehole as they would appear projected onto a flat surface, mimicking the expected appearance of a slabbed-core or outcrop view. As with the virtual-core format, the slab core is typically shown in reports oriented based either on prevailing structure or arbitrarily aligned (for example, toward North).
4.6.4.2 Interpreted Structure Logs
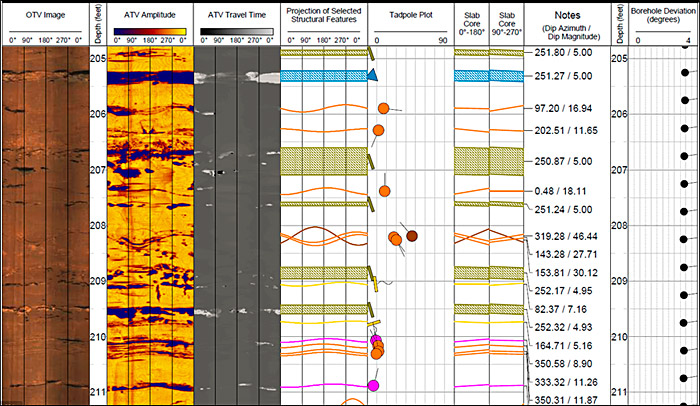
A log analyst may use the image log output and processing software to prepare interpretive logs, such as a structure log depicting the attitude (strike and dip, or dip/dip azimuth) of each planar feature identified. Commonly, the log analyst uses the output of the image-logging probes (and other probes, discussed below), processing software, and significant professional judgment to prepare an interpretive structure log depicting the attitude of each planar feature. The structure log is usually presented as a plot of colored sinusoidal lines over or next to a copy of either the unrolled OTV or ATV logs, along with accompanying tadpole plots and notes. Tadpole plots represent the azimuth and magnitude of the dip of planar features as follows: dip azimuth is shown by the compass direction in which the tail on the tadpole is pointing, and dip magnitude is shown by the left-to-right position in which the tadpole is placed on a scale from 0° to 90° of dip. Notes are used to describe key features of the well, including the attitude (orientation) of planar features, such as interpreted sedimentary bedding and fractures. An example of a structure log (incorporating both OTV and ATV) is shown in Figure 4‑14.
These interpretive logs incorporate significant judgments made by the log analyst, often considering data from more than one logging tool. For example, if both OTV and ATV are used, both are considered when developing the structure log. If the structural-feature classifications employed by the log analyst make reference to apparent capacity of a feature to yield water to the well, the interpretive log depicts the apparent water-yielding fractures or intervals. The analyst’s interpretation is based on considering not only the tools used to create the structural log, but also those indicative of potential fluid movement (fluid temperature, fluid resistivity, and heat-pulse flowmeter).
Figure 4‑14. Example of a structure log (incorporating both OTV and ATV).
Source: (Peterson 2017), Used with permission
Planar-feature orientation is described using the dip azimuth, dip magnitude convention. The dip azimuth is the compass direction (measured from true north) pointing toward the direction of maximum dip. The dip magnitude is the angle down from horizontal of a line in a planar feature pointing down dip. For example, a designation of 316, 12 refers to a planar feature whose maximum dip is 12° from horizontal, pointing toward azimuth 316° degrees (in the northwest compass quadrant). Colors selected for plotted sinusoids and tadpoles correspond to the specific feature classifications applied by the log analyst.
Structure plots showing lower hemisphere, equal area (or Schmidt) stereonet plots of dip azimuth for interpreted planar features may also be provided, either in a column of the structure log or on separate pages, employing the same feature classification color scheme. When plotted on the structure log, the stereonets can be shown to represent populations of planar features occurring within individual depth intervals (perhaps corresponding to lithologic units). In Figure 4‑15, four separate stereonets are provided to show all features interpreted as bedding, banding, or foliation (left column); all identified fractures (center column, top); inferred bedding-parallel fractures (in this case, those fractures with orientations within +/-25° of the bedding dip azimuth and within +/-3.5° of expected bedding dip based on area geological mapping – center column, bottom); and a Rose plot showing dip azimuths of all fractures interpreted from the ATV logs (right column).
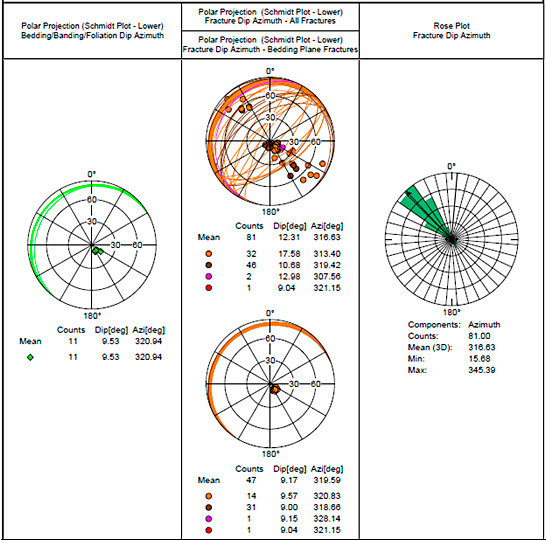
Figure 4‑15. Example stereonet plots commonly used to represent conditions throughout the borehole.
Source: (Peterson 2017), Used with permission
Geologists have devised a number of plotting conventions to graphically depict bedrock fabric data and allow for statistical evaluation of these data. The two types used by most geophysical service providers include the compass rose and stereonet plots. The compass rose (shown above at right) shows the strike of a planar feature on a 360° circular compass. The number of measured planes that fall within a specified azimuth arc (typically, every 10°) is indicated by the length of the colored pie-shaped ray comprising the azimuth range. A compass rose plot does not specify planar dip and is therefore a 2-D depiction. The value of this display may be lessened for shallow-dipping or subhorizontal features.
Three-dimensional planar attitudes are represented on a stereonet diagram whereby a line bisecting a plane is shown as a single dot (or pole) projected onto a lower hemisphere. The lower hemisphere is constructed with both compass and angular dip angles represented by lines of latitude and longitude. Equal area stereonets are constructed to contain an equal projection area for each angular field represented by all possible planar orientations. This construction allows the determination of planar orientations by statistically analyzing pole density plotted in a given stereonet cell. Thus, a steeply dipping plane is represented as a single dot near the perimeter of the circular stereonet plot, and the planar strike is normal to the compass heading of the dot. Conversely, a flat-lying plane is plot near the center (or south pole) of the stereonet projection.
It should also be noted that most geophysical service providers report planar orientation from OTV and ATV logging in a dip-azimuth and dip-angle format. Dip azimuth is perpendicular to planar strike and requires data conversion to present the orientation of the plane as a standard strike and dip symbol typically used on geologic maps.
4.6.4.3 Key Considerations for Virtual-Core Interpretation
The familiar (image) format of OTV and ATV logs can lead to errors or misuse when inexperienced users become overconfident. Common problems include:
- assuming that fracture aperture evident in the borehole image is the same as in undisturbed formation (damage during drilling tends to enlarge fractures at the borehole)
- assuming that all thin, planar features are fractures (while comparison to other logs may reveal them to be filled)
- assuming that all apparently open fractures are hydraulically conductive (while comparison to fluid or HPFM logs may indicate otherwise)
- failing to apply QC measures (for example, not correcting for vertical deviation or borehole diameter), resulting in structure log data of unknown accuracy
When adjusting raw magnetic north data to true north for log presentation, the log analyst must be careful to ensure that the correct direction for the adjustment is applied. It is easy to make the mistake of applying the correct magnitude of declination but wrong direction (introducing dip-azimuth error equal to twice the magnetic declination). Therefore, checking dip-azimuth data against what is known from other on-site or regional studies is always a good idea.
Other considerations relate to how the image log (and other log) data are used in the overall site assessment. The first consideration pertains to the underutilization of geophysical logging data. At times, multiparameter logging projects are conducted at numerous wells on a site, but the resulting data are used only for limited purposes (for example, to support packer testing or well-screen placement). Project objectives in these cases are further advanced by correlating log results between wells to develop a sitewide framework. The second consideration relates the scale of the site and problem at hand. Structural data collected at single location may be suitable to evaluate a small site (for example, a small BTEX plume at an UST site). Investigating more complex conditions over a larger area (for example, chlorinated VOCs plume at a DNAPL site) may warrant a sitewide evaluation that employs multi-well log correlation and three-point structural evaluations. In this case, a structure log from a single borehole probably is not sufficient to characterize the aquifer matrix.
When analyzing data derived from distinct sources or methods, the genesis and population of the data should be considered. A typical outcrop study may result in a dozen or less measurements of planar features over a moderately sized area whereas a single borehole can generate 50 or more such data points from a single point on a site plan. Conversely, it is important to consider that a vertical boring is less liekley to intersect vertical and steeply dipping fractures than horizontal and shallow dipping fractures present within the bedrock formation that may be readily observable in an outcrop. Mixing these data types produces results skewed toward the borehole data, overpowering field measurements and making distinctions difficult to recognize. Other situations may arise where vertical changes in a borehole (such as formation change, fault) may result in distinct data populations from a single borehole. In both cases, the distinct datasets should be analyzed separately to evaluate results and collectively identify similarities and differences in the datasets. These decisions regarding data analysis can be somewhat subjective and require informed expertise regarding the regional and local site geology and data procurement methods.
4.7 Natural Gamma Logging
Gamma logging uses a passive detector lowered in a borehole via wireline to measure natural gamma radiation in the borehole. Gamma radiation is emitted from common radioisotopes, primarily potassium-40 and daughter products of uranium and thorium decay, which are useful indicators of lithology. The strength of the natural gamma radiation decreases with distance from the borehole wall. Thus, the larger the diameter of the borehole, the lower the resolution of the natural gamma log.
Earth materials have varying amounts of naturally occurring gamma emitters. Potassium-40 and, to a lesser extent, uranium and thorium tend to be more concentrated in clays and fine-grained materials. Clean silica sands generally contain few gamma emitters. Many factors affect the radioactivity of soil and rock materials and need to be considered when interpreting gamma logs. Sands that contain high amounts of potassium feldspar emit higher gamma radiation due to the potassium content. The potential for uranium deposition in certain regions and environments must also be considered when interpreting logs.
4.7.1 Use and Application
The most common application of gamma logging is for lithologic characterization and stratigraphic correlation. Gamma-logging results are objective and repeatable, and, when viewed in vertical profile, stratigraphic information can be derived and used to develop CSMs through characteristic curve-matching and cross-borehole correlations. Where clay minerals contribute to a significant portion of the gamma response, gamma logs can be used to estimate the fraction of clay present, represented by the clay volume divided by the total rock volume.
In igneous and metamorphic rocks, gamma response is generally dependent on minerals in the rock, although water-bearing fractures can exhibit high gamma response due to the precipitation of uranium or other radioactive minerals along fracture walls. Under certain circumstances, gamma logs can be a good indicator of water-bearing fractures.
Key considerations during gamma logging are logging speed and distance from the source to the detector. Based on background conditions, logging speeds can be optimized to observe variations between clay-bearing and clean sandy soils. Slower logging rates may be required to obtain a higher resolution of data across a site and identify smaller variations in lithology; higher logging rates, which increase the footage rate of data collected, may be sufficient to characterize geologic lenses that are of greater thickness. A consistent borehole diameter is optimal in reducing the variability caused by the distance between the detector and the soil matrix. Gamma logging should always be accompanied by a caliper log when logging in open boreholes. The accompanying caliper logging is used to identify potential variabilities of the borehole wall diameter that might impact data quality. A centralizer is also recommended to keep the gamma detector within the center of the borehole. Where borehole washouts are present, the gamma response is reduced regardless of soil or rock type.
4.7.2 Data Collection Design
Gamma logs are acquired in a similar manner as most other borehole geophysical logs but do not require fluid-filled boreholes or casing. When logging in existing monitoring or extraction wells, certain well construction features that could affect data quality, including the original borehole diameter, annular fill outside the casing, and casing material, should be considered. Smaller borehole and casing diameters provide higher-quality results with better vertical resolution.
As with other borehole geophysical tools, logging at a single location provides parameter data only in the immediate vicinity of that location. By logging multiple locations, data can be correlated over greater distances and provide 2-D (cross-sectional) and 3-D conceptual models. The density of well locations to be logged should be based on the stratigraphic framework and the nature of features that the investigation is attempting to resolve.
4.7.3 Log Interpretation
Gamma log data are usually processed and can be displayed in real-time. Geophysical reports may present the gamma logs for different borings on different response scales for counts per second, especially if logging occurs over multiple field events. When interpreting gamma responses and correlating logs between boreholes, verify that the response scaling is the same. Some geophysical contractors color code the response curve with a filled hatch pattern, which can be useful for rapid visual correlations, but misleading if the response scalings differ. Data interpretation is straight forward as shown in the example log displayed below (see Figure 4‑16). Other example logs are available on the USGS Geophysical logs – gamma logs webpage (USGS 2000a).
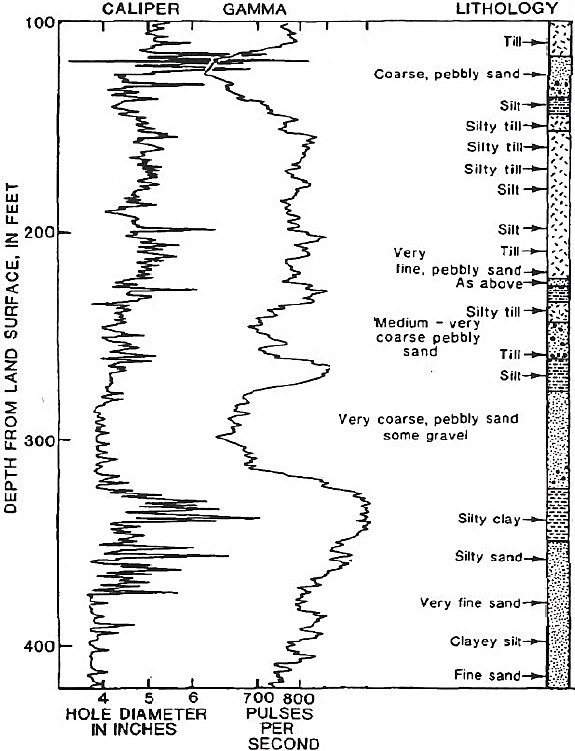
Figure 4‑16. Example gamma log output with caliper log and lithology.
Source: Adapted from (USACE 1995), Figure 7-8
4.8 Borehole Flow Meters
Understanding flow within the subsurface is a critical component of any CSM. Historically groundwater potentiometric surface maps have been used to illustrate hydraulic-head differences across a site and aid in the interpretation of lateral flow within the subsurface. In addition, setting a group of wells at a location with the screens of the individual wells set at varying depths (for example, a well cluster) can provide a general understanding of vertical hydraulic gradients within and between different aquifers present at a site. The use of specialty tools that allow for the direct measurement of flow within the borehole can supplement this information and provide a flow-measurement rate as opposed to simply a change in hydraulic head.
4.8.1 Heat-Pulse Flow Meter Logging
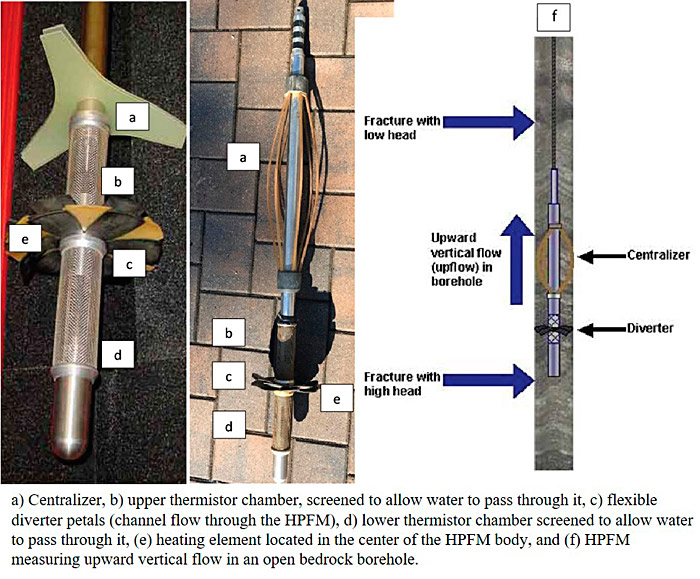
The HPFM measures the vertical direction and rate of groundwater flow in an open borehole completed in bedrock. The HPFM uses a pulse of heated water to detect vertical groundwater flow, hence the name of the tool. The HPFM is run after the borehole has been completed to depth and flushed of cuttings and other logs have been run and analyzed to select potentially transmissive features (targets) in the borehole (for example, fractures, bedding planes, joints). The HPFM works as follows (see Figure 4‑17):
- The HPFM is run in the water-filled interval of an open borehole.
- The instrument is positioned at a station above or below a target and held stationary in that position until the test is completed. Care must be taken by the operator when selecting a station to position the instrument close to the target and in a section of borehole wall where the diverter can form a good seal with the borehole wall.
- A diverter with a diameter flush with the borehole wall channels vertical groundwater flow through the instrument.
- The instrument is triggered by the operator and an electric element in the center of the instrument rapidly heats up a small volume of water to generate a pulse of heated water.
- Vertical groundwater flow carries the heated water up or down where it is detected by thermistors positioned above and below the heating element.
- After data are collected, the reading can be repeated or the instrument is moved to the next station.
Heat-pulse data are collected in the borehole under ambient, or natural, flow conditions and then under pumped conditions. Under pumped conditions, a submersible pump is installed in the well near the top of the water column and run at a low flow rate, typically about 1 gallon per minute (gpm). This flow rate allows the head in the borehole to change yet remain stable. The HPFM log is then repeated at the same stations as the ambient flow log. The developed from the pumped conditions may identify transmissive features that were not detected by the ambient log because the head in the borehole and the fracture were the same under ambient conditions.
Data are typically only collected in one direction. The HPFM is run alone and not in combination with other probes.
4.8.1.1 Uses
The value of the HPFM is that its resulting data reveal features in the borehole that are transmissive, that is, where water is entering and exiting the borehole. HPFM data also reveal the relative head distribution in the borehole. For example, features where water is entering the borehole have a higher head than features where water is existing the borehole (see Figure 4‑17f). This information, coupled with data from other logs, is used to define the site geologic framework, the hydrogeologic framework, and groundwater contaminant migration pathways.
4.8.1.2 Tool Availability
A heat-pulse flow meter is pictured in Figure 4‑17. The diameter of this tool is about 50 mm (2 inches); it is about 1.2-m (48 inches) long and weighs about 5 kilograms (12 pounds). The typical flow measurement range of this instrument is 0.03 gpm to 1.0 gpm (0.113 L/m to 3.785 L/m). The HPFM requires centralization and uses a diverter to channel vertical flow in the borehole through the body of the instrument (see Figure 4‑17). A geophysical logging contractor performs HPFM logging due to the specialized nature of the HPFM and the expertise and experience required to use the associated software.
Figure 4‑17. HPFM.
Source: Left and right images -(USGS 2016b); middle image: Robert Garfield, Hager Richter Geosciences, Used with permission
4.8.1.3 Technical Advantages and Limitations
Compared to other logs that provide an image of the borehole wall or measure the physical properties of the formation, the technical advantage of the HPFM is that it measures the direction and rate of vertical groundwater flow in the borehole. This, coupled with data from other logs, can be used to define the site geologic framework, the hydrogeologic framework, and groundwater contaminant migration pathways.
The limitations of the HPFM are that it detects the most transmissive features in a borehole due to its range of operation. The minimum flow rate it can detect is about 0.03 gpm; therefore, a reading of zero flow should be interpreted as flow <0.03 gpm. It is important to note that transmissive features may be present outside the range of detection of the HPFM. Likewise, the maximum flow rate the HPFM can detect is about 1 gpm, which is sufficient for many site investigations. (A spinner flow can be used to measure higher flow rates; see Section 4.8.2) Another limitation of the HPFM is associated with the diameter of the borehole. Because flow must be diverted through the instrument, it is best to conduct the log in boreholes ranging from 4 inches to 8 inches in diameter.
4.8.1.4 Quality Control
QC when using the HPFM consists of the following elements:
- Before, during, and after use, document that the instrument is working and accurately measuring flow. To test operation, position the HPFM near the top of the water column, ideally in the casing; install the pump above the HPFM, and run the pump at a specific flow rate (for example, 0.5 gpm). Measure the discharge from the pump to confirm the flow rate, and then check the flow rate reported by the HPFM. The two values should match within the accuracy and resolution of the instrument.
- Allow fluid flow to stabilize after the HPFM is moved to a specified depth in the borehole is reached before proceeding with flow measurements. Moving the HPFM can cause vertical flow.
- Collect multiple measurements to allow for the differentiation between tool-induced flow and borehole flow.
- Monitor the water level in the borehole during logging under ambient and pumped conditions.
- Under pumped conditions, allow the borehole to stabilize (drawdown) before beginning the log and collecting measurements. During logging, maintain a constant flow rate to facilitate adequate data interpretations.
- To determine if the flow rate is beyond the range of detection for the HPFM (<0.03 gpm or >1.0 gpm).
- Move the instrument, stop it, trigger it immediately, to detect if flow is caused by instrument movement.
- If flow is detected, keep the instrument stationary, and trigger the instrument again. Repeat this process. If the flow rate is zero, each subsequent pulse takes longer to reach the thermistor because the movement of water caused by the motion of the instrument is dissipating.
- If flow should be present based on other logs and previous flow measurements and is not, modify the diverter to increase bypass around the instrument and decrease flow through the instrument into the range the HPFM can detect. Document modifications in the geophysical report and consider modifications when interpreting results.
4.8.1.5 Data Collection Design
The HPFM is typically used as part of a suite of borehole logging tools and is used after other logs, such as caliper, ATV, OTV, and fluid temperature and conductivity, have been completed and analyzed to identify potentially transmissive (water bearing) features. These potentially transmissive features are termed targets. Stations for HPFM readings are identified above and below each target where the borehole wall is relatively smooth. Readings are collected at each station and then compared to assess whether water is entering or exiting the borehole at the feature. The HPFM is then run alone (it is not run in combination with other probes).
4.8.1.6 Data Interpretation and Presentation
Figure 4‑18 illustrates the interpretation and presentation of HPFM data, outlined in red, in context with other geophysical logs, a FLUTeTM transmissivity profile, sample results, and a FLUTeTM multilevel well design. The OTV, ATV, natural gamma, caliper, and fluid conductivity, and temperature are run first and then interpreted to identify targets and stations for HPFM readings). The HPFM ambient log is then run followed by the HPFM pumping log. To facilitate analysis, the HPFM logs are overlain on one another and the horizontal scale the same for each log: flow in gpm with zero in the middle. In this example, the ambient log (blue circles) shows no vertical flow. The pumped log (red circles) shows water-entry zones at about 120 ft, 110 ft, and 100 ft. (Water is flowing into the borehole from these features to supply the pump.) This information is used to locate downhole samples and design the FLUTeTM well (shown to the left of the HPFM log). The HPFM data can be modeled to estimate the transmissivity of features in the borehole using the flow-log analysis of single holes (FLASH) model developed by the USGS as described in (Day-Lewis 2011) and using the computer code described in (Day-Lewis et al. 2011).
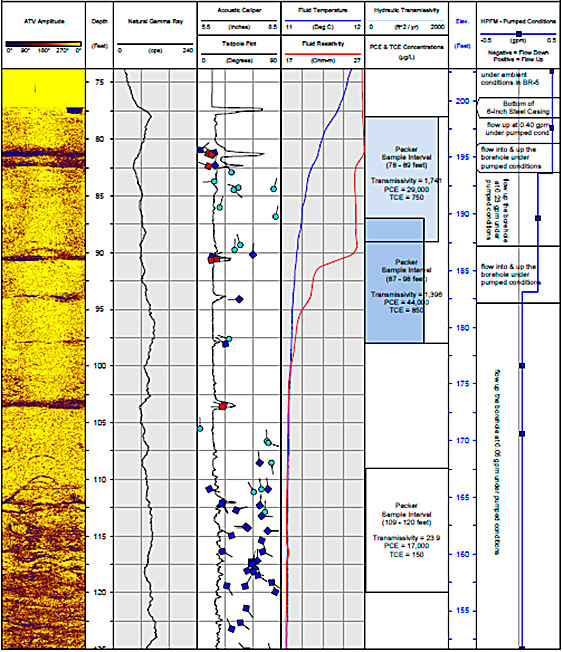
Figure 4‑18. Heat pulse flow meter data presentation and analysis.
Source: (Weston 2014)
4.8.2 Impeller Flow Meter Geophysical Logging
The impeller, or spinner, flow meter (see Figure 4‑19) is used to measure the rate and direction of vertical fluid movement in a borehole produced by a difference in hydraulic head between two permeable units. This tool was developed over 70 years ago for the petroleum industry and is one of the oldest borehole logging tools for measuring fluid flow in a borehole. Impeller flow meters may be made out of stainless steel, plastic, brass, or titanium. Additional components include centralizers and a protective basket or cage around the impeller. The tool has a sensor, a low-inertia mechanical impeller mounted on precision tungsten carbide or jeweled bearings that revolve in response to fluid flow. As the impeller revolves, it generates electrical pulses that are converted to counts per second or per minute. The count rate is related to the fluid velocity and converted to fluid flow rate by use of a calibration curve. The two most common technologies for rotation sensors are Hall-effect sensors (magnetic) and optical. An overview of this tool and associated literature references is available on the USGS Vertical Flowmeter Logging webpage (USGS 2016a).
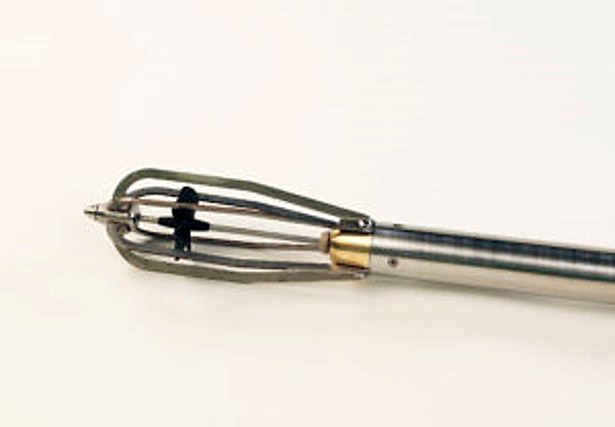
Figure 4‑19. Spin flow meter probe.
Source: Photo courtesy of Mount Sopris Instruments, Used with permission
4.8.2.1 Uses
The impeller flow meter can be run in a cased well and in an open borehole. It can be used to measure the rate and direction of vertical fluid movement produced by a difference in hydraulic head between two permeable units. It can also be used to measure relative hydraulic gradients, identify permeable units or fractures, identify leaking casing, or characterize the flow within a screened interval.
4.8.2.2 Tool Availability
Impeller flow meters are produced by most borehole logging tool manufacturers and usually come with multiple sizes of impellers, cages, and centralizers to accommodate a range of borehole diameters. When selecting an impeller flowmeter to use, choose the one with the largest impeller blades and lowest friction bearings that produce the highest number of pulses per revolution. Most impeller flow meters can be run on a single or four-conductor logging cable and require a logging winch with tripod and uphole electronic panel or controller to interface to a computer.
4.8.2.3 Technical Limitations
The impeller flow meter is generally considered a low-resolution tool. The low-threshold velocity of a typical impeller flow meter is around 5 ft/min, which limits its use to conditions with higher flow rates. The logging speeds for this tool can be quite high, so attention must be paid to the location in the well or borehole in relation to the bottom and to the placement of the pump. The Hall-effect sensor and optical rotation sensor are both subject to malfunctioning if the borehole fluid has debris, sediment, grease, or sand. Moreover, if the tool is assembled with too much pressure on the impeller bearing, the rotation will be impaired and provide incorrect data. Another interference source can come from variations in the viscosity of the borehole fluid, such as caused by gas bubbles.
4.8.2.4 Quality Control
The impeller should always be run centralized so that the best sample of the laminar flow region of the center of the borehole or well can be collected. The logging speed should be maintained constant and recorded with the flow meter data. A caliper log must be run; logging data should be presented with the flow meter data for borehole and casing diameter corrections. Runs should be made logging down and logging up for a select suite of logging speeds, and repeat runs should be made. Calibration data should be recorded in the cased portion of the well, when possible, logging up and logging down for at least three different logging speeds to generate a calibration curve.
4.8.2.5 Data Collection Design
The impeller flow meter can operate under ambient conditions and under stressed conditions (pumping or injecting) while moving down or up or while the impeller is held stationary at a specific depth. When planning an open-hole impeller flow meter test, it is important to know the water level in the borehole or well, and the configuration of the borehole or well (for example, bottom of the borehole or well, bottom of surface casing, the position of the well screen or open interval). Supporting borehole geophysical logs, such as caliper, fluid temperature and conductivity, and televiewers provide insight to probable flow zones. When running stress tests, it is critical to maintain a constant pumping or injecting rate and monitor the rate to obtain good quality data.
4.8.2.6 Data Interpretation and Presentation
Impeller flow meter data can be viewed and plotted in standard borehole logging software packages and processed in Microsoft Excel. Additionally, flow meter results can be modeled for transmissivity and head using readily available code such as the USGS’s FLASH (USGS 2018a).
4.9 Advanced Borehole Logging Tools
4.9.1 Electrical Resistivity
Resistivity logging is most commonly used in bedrock or deep boreholes where high-resolution data cannot be collected using direct sensing methods. Resistivity logging includes several downhole wireline tools that measure the degree to which subsurface materials resist the flow of electrical current. Tools are available to measure the resistivity of various downhole materials, including borehole fluids, the invaded zone (formation materials in the immediate vicinity of the borehole that have been invaded by borehole fluids), and deeper volumes of the formation beyond the invaded zone. Resistivity is the direct inverse of EC and is measured in Ωm. It is a fundamental property of the material sampled defined as:
R = r*S/L
where R = resistivity (Ωm), r = resistance (Ω), S = the cross-sectional area being measured (m2), and L is the length (m)
The resistivity of formation materials is affected by properties of both the matrix material (mineralogy, porosity, permeability) as well as material occupying the pore spaces (gas or pore fluids). Clay minerals and metallic minerals are typically more conductive than other minerals, such as quartz. In water-saturated pores, resistivity is a function of the concentration of dissolved electrolytes in the water (salt water is highly conductive; fresh water is less conductive. Deionized water and air are infinitely resistive, as are many hydrocarbons. Because of these differences, resistivity can often be used as a lithologic indicator as well as an indicator of formation porosity, permeability, and pore fluid chemistry. The relative resistivity of various earth materials is shown in Table 4‑2.
Table 4‑2. Typical electrical resistivities of earth materials
Source: (Wightman 2004)
| Material | Resistivity (Wm) |
|---|---|
| Clay | 1-20 |
| Sand – wet to moist | 20-200 |
| Shale | 1-500 |
| Porous limestone | 100-1,000 |
| Dense limestone | 1,000- 1,000,000 |
| Metamorphic rocks | 50-1,000,000 |
| Igneous rocks | 100-1,000,000 |
Normal resistivity is the most commonly-used resistivity-logging tool and incorporates four electrodes set at two electrode spacings (usually 16 inches and 64 inches) that provide variable depths of investigation. The shorter spacing measures resistivity of the invaded zone, and the longer spacing measures resistivity of the invaded zone and deeper native formation. The tool measures apparent resistivity, which must be converted to true resistivity for quantitative interpretations. Another resistivity-logging tool is the lateral log, which incorporates electrodes in a different configuration designed to measure only the resistivity of the native formation beyond the invaded zone. In addition, focused resistivity logging tools, such as the guard log, have an even greater depth of investigation and can provide higher resolution and thin-bed detection.
Resistivity logs must be collected in fluid-filled open boreholes. An alternative to resistivity logging is induction logging which measures formation conductivity (the inverse of resistivity). Induction logging is accomplished by transmitting an alternating current (AC) that generates a magnetic field that induces eddy currents in conductive materials. The eddy currents result in a secondary magnetic field that induces a voltage in a receiving coil. The magnitude of the voltage is a function of the conductivity of the formation material. An advantage of induction logging is that it can measure formation conductivity (and thus resistivity) with or without fluid in the borehole and through plastic casing in existing wells.
4.9.1.1 Uses
The most common application of multielectrode-resistivity logging is lithologic characterization and pore-water quality determination. Due to the many factors that contribute to apparent resistivity measurements, experience interpreting resistivity logs is advantageous when performing quantitative analyses. The methods and algorithms used for quantitative interpretation are beyond the scope of this document but can be obtained from a number of available sources.
Like other lithologic characterization tools, resistivity logs can serve as a correlation tool (where multiple logs are available within reasonable proximity to each other) to resolve desired stratigraphic features. Resistivity logs can also be useful when investigating salt-water and fresh-water issues associated with aquifers.
Downhole-resistivity logging is a useful method to assess lithology and pore-fluid characteristics. It is one of the most common borehole geophysical logging methods used and is widely available from most geophysical services providers. Qualitative interpretation is facilitated by an understanding of the primary factors that influence apparent resistivity responses. Quantitative interpretation can provide insight into parameters of interest such as formation pore-water quality and porosity. The type and configuration of the resistivity-logging tool selected depends on site-specific conditions and the investigation goals. Multielectrode-resistivity logs are often acquired with other logs (spontaneous potential, single-point resistance) as part of a suite of tools providing multiple lines of evidence.
4.9.1.2 Technical Limitations
The primary limitation of resistivity logging is that quantitative interpretation can be complicated by a number of variables. Collectively, these variables result in nonunique solutions to established analytical approaches. Corrections for temperature, drilling-fluid resistivity, borehole diameter, mud cake, and drilling-fluid invasion may be necessary to convert apparent resistivity to true resistivity. Complicating matters, normal logs can be affected by bedding thickness as a function of electrode spacing and provide erroneous results. As such, quantitative interpretation requires experience and a thorough understanding of the regional and local geologic framework so that the proper assumptions for analytical solutions are made. Collecting ancillary data, such as water-quality sampling at sites in proximity to the area of interest can facilitate quantitative interpretations.
4.9.1.3 Quality Control
Resistivity-logging tools are calibrated using fixed resistors between electrodes. A field geologist familiar with the local hydrogeology should be present during data acquisition to assist in evaluating real-time data and identifying potential issues. As with other borehole logging tools, site-specific information (such as location, elevation, well construction details) should be recorded in the log headings for future reference.
4.9.1.4 Data Collection Design
Resistivity logging is conducted using wireline methods in a similar manner as most other borehole geophysical logging tools and must be acquired in open, fluid-filled boreholes. Alternatively, induction logs can be acquired with or without fluid in the borehole and in existing wells with plastic casing. Resistivity logs measure apparent resistivity within the zone of investigation and are influenced by a number of factors, such as temperature, drilling-fluid resistivity, borehole diameter, mud cake, and drilling fluid invasion. To use resistivity logs for quantitative analyses, these factors must be considered during logging and recorded in the log headings.
The requirement for open, fluid-filled boreholes means that geophysical logging should be conducted soon after the borehole is completed and stabilized by the driller. This approach requires communication and coordination with the geophysical service provider to minimize costs for standby time. Logging is usually conducted on a borehole-by-borehole basis rather than logging multiple boreholes in a single mobilization. In cases where the well design requires telescoping casing, mobilization and logging must be conducted prior to setting each casing string.
As with other borehole geophysical tools, logging at a single location provides parameter data only in the immediate vicinity of that location. By logging multiple locations, data can be correlated over greater distances to provide 2-D and 3-D conceptual models. The density of well locations to be logged should be based on the stratigraphic framework and the nature of features that the investigation is attempting to resolve.
4.9.1.5 Data Interpretation and Presentation
Resistivity-logging data are usually processed and displayed in real-time. A typical log suite, referred to as an electric log, is shown in Figure 4‑20 with lithologic interpretation.
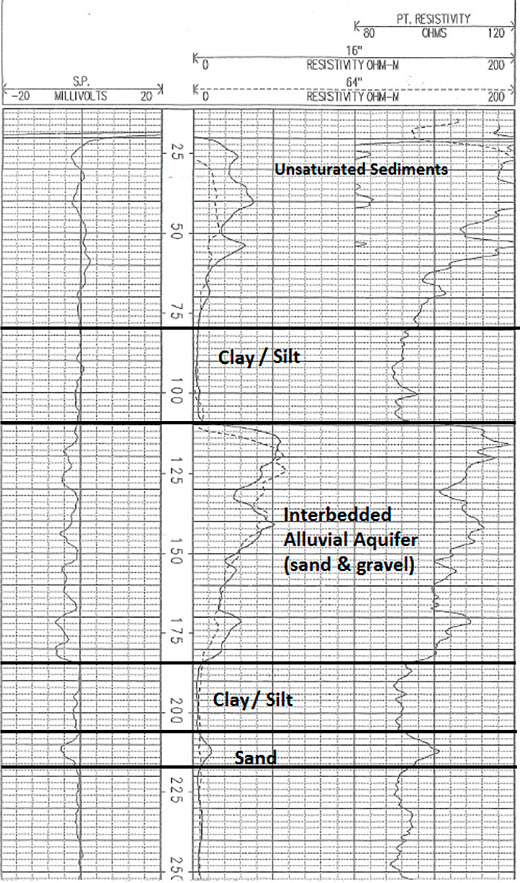
Figure 4‑20. Example electric log with spontaneous potential (left column), normal resistivity (16 inch and 64 inch) and single-point resistance outputs.
Source: ERM, Used with permission
In Figure 4‑20, lithologic interpretations are based on inflections of the resistivity curves to the right of the baseline, indicating an increase in resistivity associated with nonclay-bearing sediments. Clay intervals have an apparent resistivity of <5Ωm while the alluvial aquifer interval has an apparent resistivity between 20 Ωm and 50 Ωm. In this example, the pore fluid in the alluvial aquifer is fresh water. If saline or brackish water were present, the apparent resistivity would be significantly lower, which would make determining lithology more difficult. Another example of a resistivity log results are available on the USGS Geophysical logs – Spontaneous-potential log webpage (USGS 2000b).
Quantitative interpretation of resistivity logs involves making corrections to apparent resistivity (logged values) by applying various correction factors for such measurements as borehole diameter, drilling-fluid resistivity, depth of drilling-fluid invasion, and bed thickness. Logging manuals with correction charts are readily available on the internet and elsewhere to assist with log analysis (Schlumberger 2009).
4.9.1.6 Data Misuse
Many factors affect the material resistivity within the zone of investigation and the apparent resistivity log response. While qualitative interpretation can be straightforward for most near-surface investigations in fresh-water saturated sediments, quantitative interpretation requires experience and a thorough understanding of log responses to a number of variables. Reference materials are readily available to facilitate log interpretation, although familiarity with resistivity logging and the local geologic and hydrogeologic framework are critical.
4.9.2 Nuclear Magnetic Resonance
NMR technology uses a quantum physical property of hydrogen atoms and the response of hydrogen atoms to magnetic field perturbations, similar to magnetic resonance imaging used in the medical industry. NMR geophysics has been widely used in the petroleum industry as an exploration and oil-field development tool since the 1960s. Traditionally applied, NMR provides quantitative estimates of total porosity, pore-size distribution, permeability, and relative pore-fluid saturations of oil and water. The oil-field NMR tools were developed for deep subsurface bedrock applications and are typically expensive and cumbersome to deploy, making them impractical for near-surface investigations. In recent years, modified NMR logging tools have been developed that are easily and cost effectively used to acquire high-resolution hydrogeologic parameter data for shallow unsaturated (vadose) zone and aquifer investigations. NMR logging provides continuous, high-resolution data throughout the interval logged using either wireline or push-tool data acquisition methods. Surface NMR geophysical methods are also available but are not discussed in this document. Wireline data acquisition can be applied in stable open boreholes or in existing groundwater monitoring or extraction wells provided the casing materials are nonmetallic. Data are acquired from multiple narrow bands of soil matrix at various radii from the center of the NMR logging tool (called the sensitive diameter, see Figure 4‑21). This method allows formation conditions beyond the disturbed area in the vicinity of the borehole or well to be assessed.
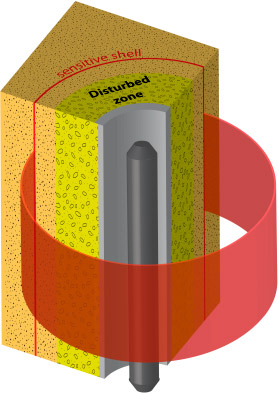
Figure 4‑21. Sensitive shell (diameter from center of tool) where NMR data collected.
Source: Vista Clara, Inc., Used with permission
4.9.2.1 Use
Parameters that can be quantified include residual-water saturation (vadose zone), total porosity, mobile porosity, bound porosity (clay or capillary bound), hydraulic conductivity, and multiphased saturations for certain NAPL that are present in the aquifer. Based on pore-size distributions and relative mobile versus bound water content, lithology can be indirectly inferred. As stated previously, NMR can be deployed in stable boreholes, existing groundwater monitoring or extraction wells, or advanced using push-tool methods to collect high-resolution data over the interval logged.
4.9.2.2 Tool Availability
Currently, only a few geophysical service providers offer turnkey near-surface NMR logging; however, NMR logging equipment can be rented and shipped by the manufacturer to most locations in the U.S. as well as globally. This option allows users to perform the logging themselves or have the equipment shipped to their preferred geophysical service provider. The basic equipment required includes the logging tool, a tripod and sheave wheel, a cable spool and winch, an electronics unit and laptop computer, a reference coil to detect background noise, and a generator. The system is designed to be easily set up and operated via user-friendly interfaces on the laptop. Following data acquisition, software installed on the laptop processes the data to provide viewable output of results in real-time.
4.9.2.3 Tool Advantages
NMR is the only available borehole geophysical tool that concurrently measures porosity, pore-size distribution, and hydraulic conductivity. Based on the pore-size distribution, NMR can also differentiate between mobile porosity and bound porosity (silt and clay) fractions. Neutron logging yields quantitative estimates of total porosity but requires using a radioactive source. This requirement can raise concerns when investigating near surface and drinking-water aquifer systems (see ASCT Borehole Geophysics Summary Table). Another advantage of NMR is its ability to detect and differentiate between water and certain petroleum hydrocarbons in pore fluids and provide quantitative estimates of the relative saturations of each.
A key advantage of NMR logging is that it can be conducted in existing PVC-cased monitoring wells, eliminating the need for additional intrusive drilling and derived-waste handling. The depth of investigation is not limited by soil conditions that preclude tool advancement, as can be the case with direct sensing tools. In addition, variations in parameters over time, such as hydrocarbon saturation or reductions in porosity due to biofilm formation, can be monitored by periodically relogging wells. The NMR tooling can also be deployed using direct-push methods, if desired.
4.9.2.4 Tool Limitations
NMR vertical resolution is somewhat limited compared to other borehole geophysical methods. Data are generally acquired in stages based on tool specifications (coil spacing) and are averaged across each stage. Most NMR tools generally provide approximately 0.5 m (approximately 1.5 ft) of vertical resolution; the direct-push NMR tool provides approximately 9 inches of vertical resolution. Tools typically log between two and four sensitive shells simultaneously with the maximum sensitive diameter varying between 6 inches and 20 inches depending on which tool is used. It is important to know the original borehole diameter to ensure that the sensitive diameter of the tool being used is measuring undisturbed soil matrix beyond the borehole wall. Table 4‑3 provides a summary of the various tools and associated features.
Table 4‑3. Example NMR tool specifications
Source: (Spurlin et al. 2019), Used with permission
| Features | JP525 | JP350 | JP238 | JP175(B) | JP175D | Dart |
|---|---|---|---|---|---|---|
| Probe diameter (inches) | 5.25 | 3.50 | 2.38 | 1.75 | 1.75 | 1.75 |
| Sensitive diameter (inches) | 20 | 15 | 12 | 8 (10) | 10 | 6 |
| Probe length (ft) | 5.5 | 6.3 | 7.1 | 7.2 | 7.2 | 4.3 |
| Vertical resolution (ft) | 1.5 | 1.5 | 1.5 | 3 | 1.5 | 9 |
| Echo spacing (milliseconds) | 0.7 | 0.7 | 0.7 | 0.9 | 0.9 | 0.5 |
| Number of shells | 4 | 4 | 4 | 2 | 2 | 2 |
| Logging speed (ft/hour) | 200 | 200 | 200 | 75 (50) | 25 | 15 |
4.9.2.5 Quality Control
NMR tools are calibrated by the manufacturer prior to use in the field. The processing software also includes calibration files that are used prior to each logging run to establish data acquisition specifications and procedures relevant to site conditions. The calibration files also specify appropriate logging speeds. Industrial noise such as power lines and electric generators in close proximity to logging can interfere with NMR signals. The equipment should be grounded, and a reference coil box must be used when logging to measure background noise. Background noise can be minimized during data processing to improve the signal-to-noise ratio. For assessing data quality during data acquisition, the signal-to noise-ratio can also be monitored in real-time using the processing software provided by the manufacturer.
4.9.2.6 Data Collection Design
NMR logging is a fairly slow process compared to other borehole geophysical methods. Logging rates of 15 m/h (approximately 50 ft/h) are typical, and for some applications the logging rate is slower. Considering time for mobilization, demobilization, and decontamination between wells, 60 m to 75 m (200 ft to 250 ft) is the maximum log production expected in a typical work day for most near-surface applications. For deeper wells with a single mobilization, greater log production is feasible.
When logging in existing monitoring or extraction wells, certain well construction considerations must be considered, including casing material (nonmetallic only), casing diameter, and the original borehole diameter. The casing diameter determines which tool can be used. In larger-diameter casings, a larger NMR tool can be used to increase the maximum sensitive diameter and improve vertical resolution. The sensitive diameter must be greater than the original borehole diameter to avoid logging the annular material outside the casing. Conversely, if the nature of the annular material of the well is of interest, a tool with a sensitive diameter can be selected to measure parameters within the annular space.
When implementing NMR logging using push-tool advancement techniques, data collection follows similar protocol to other direct sensing methods. In this case, a small-diameter casing is advanced to the maximum depth to be logged and the tool is inserted into the casing. The casing is then retracted in stages to expose the tool to the soil matrix. Following logging at each stage, the tool is raised into the casing and the casing is retracted, ready for the next logging stage. Alternatively, a blank PVC casing (permanent or temporary) can be installed in an open borehole for logging purposes.
As with other borehole geophysical tools, logging at a single location provides parameter data only in the immediate vicinity of the location. By logging multiple locations, data can be correlated over greater distances to provide 2-D and 3-D conceptual models. Based on mobile- and bound-water porosity information, transport pathways and storage intervals can be identified and mapped. The density of well locations to be logged should be based on the stratigraphic framework and the nature of features that the investigation is attempting to resolve.
4.9.2.7 Data Interpretation and Presentation
The laptop computer provided by the supplier includes software for processing and displaying the data in real-time. Data interpretation is straight forward as shown in the example log displayed below (see Figure 4‑22).
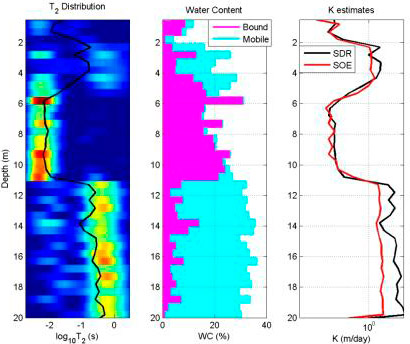
Figure 4‑22. Example NMR output.
Source: Vista Clara, Inc., Used with permission
The left column in Figure 4‑22 shows the transverse relaxation time (T2) distribution of excited hydrogen molecules derived from composite spin echo trains measured by the NMR tool. The integral of the T2 distribution reflects total water content, and the distribution along the T2 axis is indicative of water mobility. The center column shows the relative amounts of mobile and bound water, and the combination of these represents the total water content. In unsaturated media, total water content reflects the residual-water saturation. In saturated media, the total water content reflects the total porosity of the matrix material. Intervals with a high percentage of mobile water are indicative of highly permeable coarse-grained soils, and intervals with a high percentage of bound water are indicative of low permeable clays and fine-grained soils. The right column shows the estimated hydraulic conductivity distribution for the logged interval. Hydraulic conductivity is estimated from total porosity and pore-size distribution using multiple algorithms developed and empirically tested on various soil and rock types.
Other properties of pore fluids that can be measured by the NMR tool are hydrogen index and fluid diffusivity. Fluid diffusivity is the extent to which molecules move at random in the fluid. There is little difference between the hydrogen index of water and that of petroleum hydrocarbons, although the presence of petroleum hydrocarbons affects fluid diffusivity and has an inverse effect on T2 relaxation times. Using oil-field NMR technology, NMR data can be processed to evaluate those properties and derive estimates of hydrocarbon saturation within the pore space. Testing this analytical method (Spurlin et al. 2019) has shown that hydrocarbon saturations of less than 5% can be detected and semiquantitatively estimated within a reasonable margin of error. This analysis can be performed in stages within intervals of interest identified following initial NMR logging.
4.9.2.8 Data Misuse
The primary considerations when using NMR data are the vertical resolution and the sensitive diameter where data are collected. Vertical resolution is defined by the vertical length of the stage where data are collected and represents average properties of the soil matrix over the interval. If the sensitive diameter is close to or less than the original borehole diameter (and potentially disturbed zone beyond the borehole), the results obtained may not accurately reflect native soil matrix conditions. It is best to use a tool with a sensitive diameter that extends 2 inches or more beyond the original borehole wall. If the original boring was drilled with mud, the invaded zone may impact formation properties even deeper.
4.9.3 Borehole Video Survey
Borehole video surveys provide a visual record of the actual condition of a well and allows the viewer to see the actual condition of the borehole walls first hand. Under adequate conditions, the viewer can explore a wide range of subsurface environments – from 2-inch diameter monitoring wells to open boreholes and production wells exceeding 12 inches in diameter. Dual-viewing (both downhole and 360° side view), high-resolution cameras allow the viewer to identify and classify geologic features, well construction details, and obstructions, if present. Digital video recordings can be saved to a variety of electronic media or uploaded to a cloud-based platform in the field.
Borehole video camera systems range from portable systems that can reach 1,000 ft in depth to truck-mounted units capable of reaching 5,000 ft or more. Most borehole cameras are fitted inside stainless-steel housings and pressurized with nitrogen. Some models are reportedly waterproof up to 2,500 psi, which is equivalent to a submerged to a depth of 5,880 ft underwater. The housings typically range from 1.6 inches to 3.5 inches in diameter (see Figure 4‑23) and up to 22 inches in length. Digital video feeds are transmitted over single-conductor (coaxial) wireline, wrapped with armored cable.
Figure 4‑23. Example borehole video camera systems.
Source: Photos courtesy of Mount Sopris Instruments,Used with permission
In addition to the descriptions in the following paragraphs, see the example video of a video survey in bedrock (Allegheny 2013). In addition to the descriptions in the following paragraphs, see the example temperature log on the USGS Geophysical logs – Temperature log webpage (USGS 2000c).
4.9.3.1 Use
Borehole video surveys can be used to perform the following activities:
- Inspect well casing and screen.
- Document well construction.
- Identify and classify fractures.
- Identify seeps from fractures in the vadose zone.
- Identify water-bearing zones.
- Characterize lithologic or geologic features.
- Identify obstructions.
- Confirm changes in conditions before or after work.
- Document regulatory compliance and pre-well abandonment.
An important aspect of conducting a successful borehole video survey is the ability of the camera’s light source to reach the borehole walls. With the advancement of LED technology, modern borehole cameras are outfitted with more powerful and efficient LED light rings or forward-facing bulbs (pictured above). Note that halogen lighting techniques also remain in use.
Centralizer bands (thin lengths of bowed metal or plastic affixed to collars that slide over the camera) are used to keep the camera centered in the borehole or well casing throughout the survey. Real-time adjustments to the camera’s focus, light intensity, and rotation (during the side-viewing portion of the survey) are controlled remotely at the surface.
A depth encoder, often located at or near the camera system’s winch, provides the depth of the camera’s lens, from a reference point selected by the user, to the nearest tenth of a foot, on screen. Camera diagnostics, such as internal temperature and humidity, are also available to monitor the condition of the unit or for troubleshooting purposes.
4.9.3.2 Advantages
Borehole video surveys have the following advantages:
- Surveys can be conducted in submerged or open-air environments.
- The viewer is able to observe the condition of the borehole walls first hand, which is useful for classifying the subsurface geology and lithology and planning subsequent tasks (for example, hydraulic packer testing and well construction).
- If present, inflowing and outflowing features are clearly defined to an exact depth.
- The tool can be used to remove well obstructions (for example, small hand tools, piping and tubing, sampling equipment dropped or lost down a well).
- This tool is readily available for rent, purchase, or contract through a vendor.
- Surveys can often be completed in a matter of hours for wells up to 500-ft deep.
- Surveys are electronic and can be uploaded and downloaded, reproduced, or distributed quickly after completion.
4.9.3.3 Limitations
- The clarity of the image is solely reliant on the amount of light reaching the borehole walls. If the water is or becomes turbid, the camera does not receive sufficient light and the image is compromised or lost. If permitted, constantly running clean water into the well or removing water via pumping before or during the survey usually resolves the turbidity issue.
- In wells that are deviated, the camera may favor one side of the borehole wall, compromising the image.
- Many cameras are not equipped with a compass, which limits the viewer’s ability to reference or orient the features observed. Using an ATV or OTV, which include internal magnetometers (for orientation) and inclinometers (for tilt), along with a borehole video survey compensates for this limitation.
- Potential interference during the survey may include electrical issues caused by the power source or the physical hazards associated with open rock wells (for example, collapse, loose material, obstruction).
4.9.3.4 Quality Control
The following activities are recommended to control data quality:
- Check camera diagnostics such as internal temperature, pressure, humidity, and voltage/amperage during each survey, in real-time, to ensure safe camera operation, or for troubleshooting purposes.
- Reset the on-screen depth measurement prior to conducting each borehole video survey to maintain project-specific reference points. This depth measurement can be calibrated as frequently as necessary.
- Prior to performing a borehole video survey, the viewer should confirm with the operator the exact location on the camera where the depth is being referenced. It is important to note that during each portion of the video – both downhole and side view – the reference depth does not change, and the side-viewing window is often located slightly above the downhole camera lens.
- Before logging, identifiy the diameter of the well casing and borehole and adjust the camera’s centralizer bands should be adjusted to fit loosely against the borehole/casing wall.
- Note the relative size of the borehole or well and account for the camera’s proximity to the borehole wall. The viewing window may exaggerate the size of certain features. For example, a void that might appear cavernous may only be a couple of inches in length. It is important to note the relative size of the borehole or well and account for the camera’s proximity to the borehole wall. Additionally, other geophysical probes, such as a mechanical caliper or acoustic televiewer can more accurately estimate the size of the features in question.
- Before logging, confirm with the operator the planned logging speed and adjust as necessary, to meet the goals of the survey.
- Check recording devices sat regular intervals to confirm the collection (and storage) of video files.
4.9.3.5 Data Collection Design
Although the standard operating procedure for obtaining borehole videos may change from vendor to vendor or by operator and client preferences, the common practice is to record the first portion of the survey moving downward through the borehole, viewing through the downhole lens. Newer cameras allow the operator to pan and tilt the lens, but generally speaking the lens continues to point downward during this initial portion of the survey. The operator notes features of interest until the total depth of the well is reached. During this process, care should be taken to avoid borehole disturbance which could reduce camera visibility.
The second portion of the video survey is conducted while pulling the camera upward, recording through a side-viewing window. The camera lens is rotated 360° to view each side of the borehole wall. This rotation can be performed while the camera is in a static (stopped) position or while the camera is moving vertically through the hole. Because of the limited speed of the lens’ 360° rotation, a side-viewing survey is typically conducted at a slower speed than the downward-viewing survey.
Video surveys are typically viewed on a monitor or laptop computer screen provided by the operator or camera rental company. The software necessary for video display and processing should also be included. Examples of screenshots from a number of borehole video surveys are included in Figure 4‑24.
Figure 4‑24. Examples of screenshots from several borehole video surveys.
Video surveys can be recorded as MPEG video files, which could become large files. Wi-Fi capabilities in the field may allow the operator to upload video files to a cloud-based platform for easy distribution.
[1] Where specific conductance (SC) can be converted from fluid resistivity using the following equation: SC (uS/cm) = 10,000 * 1 / fluid resistivity (Ωm)
Click here to download the entire document.


