
9.5 UVOST Differentiates LNAPL Types to Allocate Financial Liabilities at a Retail Petroleum Facility in Tennessee
| Randy St. Germain Dakota Technologies, Inc. Fargo, North Dakota [email protected] |
Ed Creaden Dakota Technologies Company, LLC Overland Park, Kansas [email protected] |
| Information presented in this case study is based on investigations conducted by Southern Environmental Management & Specialties, Inc and Dakota Technologies Company – See source information below | |
The Tennessee Department of Environment and Conservation (TDEC), Division of Underground Storage Tanks (UST Division) oversees the management of UST petroleum release sites. The UST Division operates a fund to reimburse registered UST site owner and operators for certain costs associated with petroleum release assessment and cleanup. Allocation of financial liabilities can be difficult to assess where multiple sources of contamination are present, such as when an off-site petroleum release from an ineligible facility migrates onto an otherwise fund-eligible petroleum release site. Differentiation of various types of LNAPL based on high-resolution insitu data can provide key information for these determinations.
A TDEC UST Fund-eligible site located in Jackson, Tennessee, is an active retail petroleum station in operation since the 1950s, storing and dispensing gasoline from five USTs. An adjoining facility operates aboveground storage tanks (ASTs) used for storage of diesel that is not eligible for UST Fund reimbursement. Evidence of a gasoline release was suspected when an elevated benzene concentration was measured in samples from an offsite groundwater monitoring well installed during an investigation of a nearby UST site in 2012. LNAPL was subsequently identified in onsite groundwater monitoring and recovery wells in 2014.
The site is located within a wellhead protection area, with the nearest municipal well about 0.75 mile of the site. No documented drinking water wells are within 0.5 mile of the site, and the nearest surface water is approximately 0.3 mile to the northwest. The presumed direction of groundwater flow is to the southwest, and depth to groundwater typically varies from approximately 27 ft to 34 ft below ground surface. Figure 9‑19 depicts the general layout of the site, showing monitoring well, recovery well, and soil boring locations installed during previous investigation activities. Based on soil boring and monitoring well installation logs, soil generally consists of orange, gray, and brown silty clay to 10 ft to 15 ft below ground surface. From approximately 15 ft to 40 ft, unconsolidated sediment consists primarily of orange, pink, brown, and white sand with some clay, silt, and gravel.
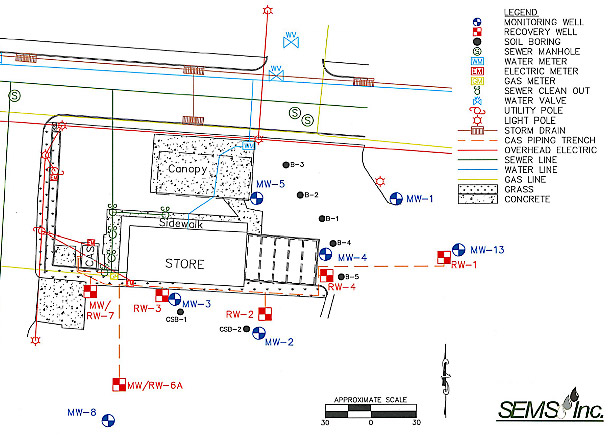
Figure 9‑19. Site map.
In April 2012, a new petroleum release case was opened for the site by TDEC based on an elevated benzene concentration in a groundwater sample from an offsite well associated with an offsite UST. The offsite well was located within approximately 10 ft of the site property line, raising concerns of a possible gasoline release at the site. Analytical results reported for a site check in July 2012 confirmed the presence of petroleum hydrocarbons in onsite soil above TDEC Initial Screening Levels.
A corrective action plan was developed in June 2013, and remedial action was taken using mobile-enhanced multi-phase extraction corrective action technology (MEME-CAT) two months later. In August 2014, LNAPL was discovered in six on-site monitoring and recovery wells, with thicknesses ranging from 0.03 ft in well MW-4 to 4.50 ft in well MW-7. Additional recovery wells were installed. Due to the persistent presence of LNAPL in MW-7, the well was converted into a recovery well in June 2016. No measurable LNAPL has been documented in the well since that time. In June 2017, an additional monitoring well (MW‑6A) was converted into a recovery well (RW-6A). Elevated concentrations of benzene (greater than 3 mg/L) persisted at five monitoring wells (MW-2, MW-3, MW-4, MW-6A, and MW-8) based on February 14, 2018 monitoring data. On February 26, 2018 0.03 ft of LNAPL was measured in one monitoring well (MW-8).
Based on the presence of LNAPL and elevated dissolved petroleum hydrocarbons in onsite monitoring wells, TDEC requested a UVOST® site characterization of the site in 2018. UVOST® and its predecessor, the Rapid Optical Screening Tool (ROSTTM), are the only commercially available laser-induced fluorescence (LIF) technologies used for high-resolution three-dimensional mapping of light nonaqueous phase liquids (LNAPLs) in the subsurface. Combining advanced analysis techniques of UVOST data with other lines of evidence such as formation hydrostratigraphy, soil and groundwater contaminant data, and historical site operational information supports the development of more robust LNAPL conceptual site models (LCSMs).
Thirty-one UVOST® borings were advanced on the site in April 2018. The average depth of the borings was 42.70 ft below ground surface. A total of 1,323.95 ft of UVOST® logging was completed over a four-day period with an average daily production of approximately 331 ft. LNAPL was detected in 28 of the 31 borings, ranging in depth from approximately 10 ft to 40 ft below ground surface. Figure 9‑20 depicts the UVOST® boring, monitoring, and recovery well locations overlain on an aerial photograph of the site.
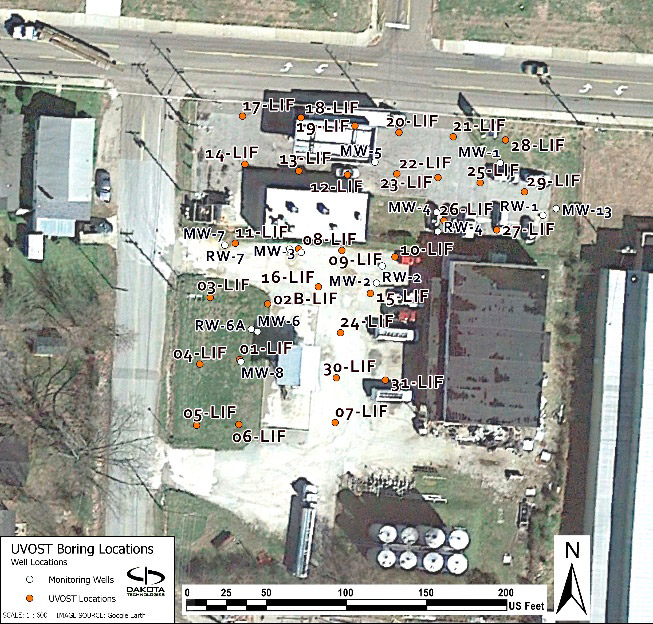
Figure 9‑20. UVOST® boring and monitoring well locations.
UVOST logs of total fluorescence versus depth were produced for all borings. Figure 9‑21 is the UVOST log from boring 20-LIF, which was installed near the gasoline USTs and dispensing pumps.
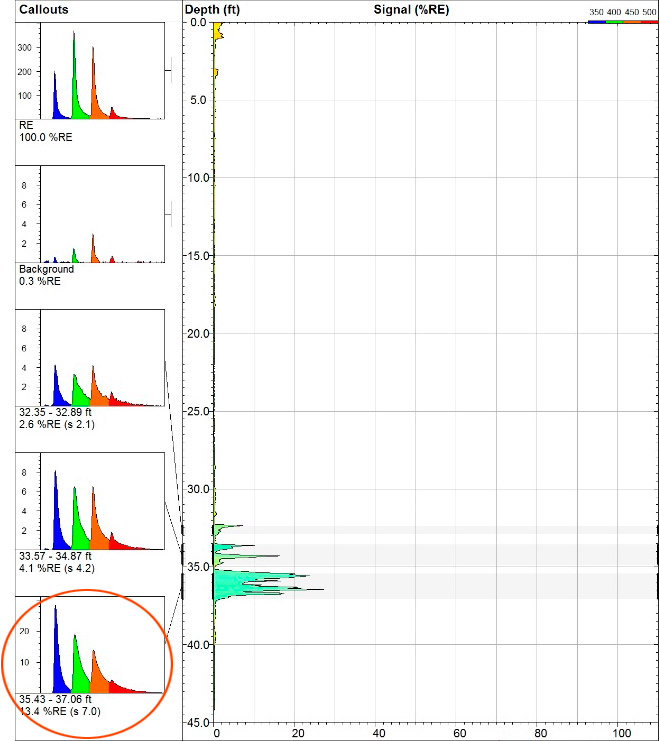
Figure 9‑21. UVOST® log for boring 20-LIF.
The waveforms from the LNAPL-bearing zone identified at approximately 35 ft to 37 ft below ground surface in this log are indicative of the presence of intact (unweathered) gasoline (see circled waveform callout in left column of log). The 350-nm channel shown as blue on the waveform callout has a fluorescence lifetime only modestly shorter than the other three channels and a relatively high intensity. The calculated color for this waveform is shown in the log as light blue (blue-shifted), which is characteristic of an intact gasoline’s fluorescence response.
In contrast to this log, the UVOST® log from boring 05-LIF (refusal encountered at 32.60 ft) shown in Figure 9‑22 exhibits a strikingly different signature. This boring was installed near the diesel aboveground storage tanks and, of the 31 borings installed, this boring was the only one to encounter refusal before achieving the targeted depth of approximately 40 to 45 ft. The waveforms from the LNAPL-bearing zone encountered at approximately 29 ft to refusal are indicative of the presence of diesel. The 350-nm channel (blue peak) has a dramatically shorter lifetime and less intensity than the three long lifetimes in the subsequent channels, which is the hallmark of a diesel fuel.
The 350 nm channel (blue peak) has a dramatically shorter lifetime and less intensity than the three long lifetimes in the subsequent channels, which is the hallmark of a diesel fuel. The calculated fill color has also dramatically red-shifted to yellow in comparison to the teal green gasoline responses in log 20-LIF.
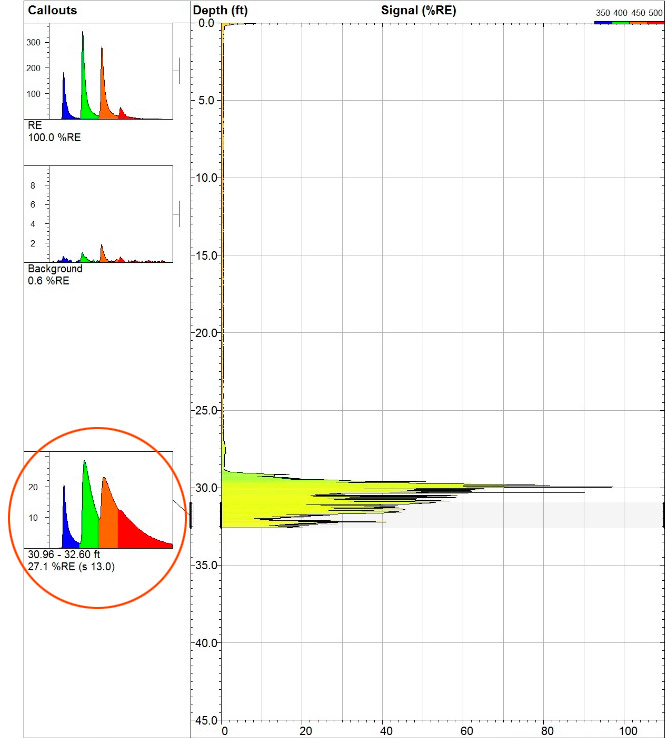
Figure 9‑22. UVOST® log for boring 05-LIF.
These waveforms and their resulting color shift in the logs alerted the investigative team in real-time that the fluorescence response at location 05-LIF was indicative of diesel fuel as opposed to the expected gasoline response.
Figure 9‑23 is the UVOST® log from boring 12-LIF, which was installed near the gasoline dispensing pumps. This boring intersected a relatively shallow, perched zone of gasoline at approximately 15 ft to 17 ft below ground surface that exhibited waveform characteristics consistent with that of weathered gasoline. The 350-nm channel has a similar fluorescence lifetime to the other three channels; however, the intensity of the 350-nm channel is relatively low (likely due to washing out of naphthalenes). The result is a red-shifted waveform and a calculated fill color that appears greener than the bluer intact gasoline response. Although less pronounced, this red-shifting and apparent weathering can also be observed in the waveform callouts in Figure 9‑21 at the 32- to 35-foot depth.
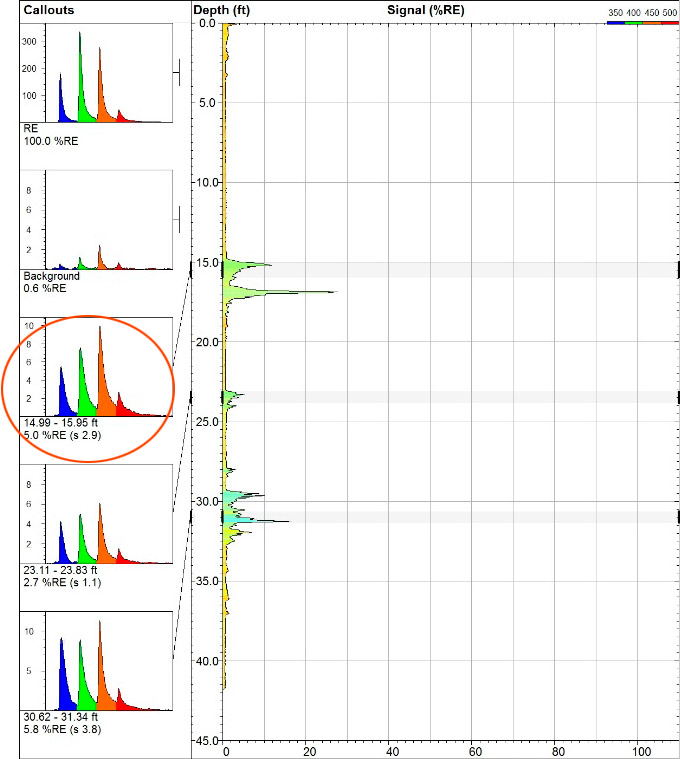
Figure 9‑23. UVOST® log for boring 12-LIF.
Investigation results indicated the likely presence of three unique types of LNAPL on site (shown in Figure 9‑21, Figure 9‑22, and Figure 9‑23) because UVOST® data exhibit characteristics of intact (unweathered) gasoline, weathered gasoline, and diesel fuel. TDEC requested advanced analysis of UVOST® data to support the differentiation of LNAPL sources and subsequent visualization in a four-dimensional CSM. The allocation of remediation and financial responsibilities will be considered based on these findings. Future investigative activities designed to confirm these findings are ongoing.
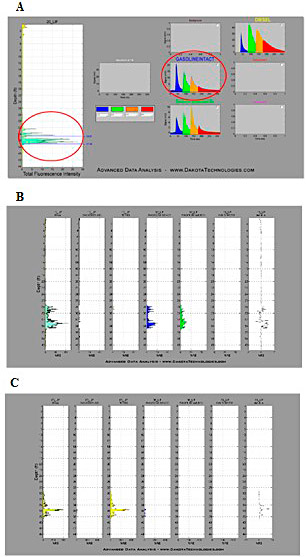
Figure 9‑24. Examples of Waveform Harvesting and NNLS Results.
In the advanced analysis, a Basis Set was created by harvesting waveforms from field logs or bench-top tests to define the various types of fluorescence encountered such as various fuel types or false positive fluorescence encountered at the site. Once the various fluorescence waveforms were accounted for in the Basis Set, software automatically fits the Basis Set waveforms to the log’s insitu waveforms, which can be in the thousands of waveforms. The analysis software passes each raw waveform, along with the Basis Set waveforms, to a non-negative least squares (NNLS) routine that determines the proportion of each of the Basis Set waveforms that is required to optimally fit the insitu waveforms and returns a %RE contribution for each Basis Set waveform. RE stands for Reference Emitter, which normalizes the LIF response similar to how using isobutylene to normalizes the response on a handheld PID. Once all the waveforms in a log have been analyzed, the software plots the original raw LIF log next to the logs that represent the fluorescence intensity that was mathematically attributable to each of the Basis Set waveforms.
Figure 9‑24 (A) depicts the harvested waveform from UVOST® boring 20-LIF, which was selected based on its close match to known intact gasoline waveform responses. In addition to intact gasoline, the fluorescence signatures of diesel, weathered gasoline, and calcite were also encountered, so they were included in the Basis Set. Panels B and C in Figure 9‑24 show the resulting LIF buckets for the Basis Set that can be independently plotted in transects or 3D visualizations.
Consideration of other lines of evidence such as general site knowledge, proximity to suspected release source(s), clustering diagrams, analytical data from prior sampling events, or any other available data that reduce uncertainty can be useful in the harvesting process.
The NNLS outputs were used to develop 3D data visualizations that depict interpolated LNAPL plume bodies, distinguished by different colors representing each unique class of fluorescence waveform (and thus fuel type).
Figure 9‑25 presents a 3D view of all the LNAPL fluorescence without regard to the type, showing UVOST® signal strength ranging from 2 %RE in blue to greater than 50 %RE in red.
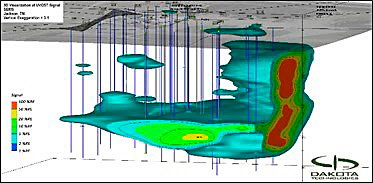
Figure 9‑25. 3D Visualization of UVOST Response >2 %RE
3D LNAPL bodies of each Basis Set fluorescence type were also generated. Visualizations of the various fuels were developed with various perspectives of the site, including horizontal slicing, vertical slicing and low to high range %RE UVOST response levels. Figure 9‑26 (A) intact Gasoline, (B) weathered Gasoline, and (C) diesel depict a 3D view with the isolation of the primary waveform classifications, based on NNLS analysis. Based on the analysis the southern area of the site contains the highest saturations of diesel LNAPL, extending as deep as 10 ft into the saturated zone. The vertical distribution of the apparent diesel LNAPL is greatest near the southern property boundary in near proximity to the diesel ASTs and an associated loading dock.
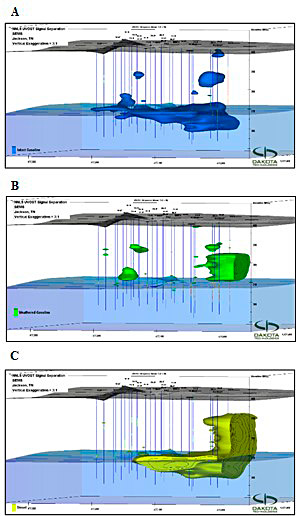
Figure 9‑26. 3D Visualizations of NNLS UVOST® Basis Set. (A) Intact Gasoline. (B) Weathered Gasoline. (C) Diesel.
In the areas closer to the gasoline USTs and dispensing pumps, discontinuous masses of weathered and intact gasoline LNAPL appear to be perched in the vadose zone, as much as 15ft above the water table. Apparent diesel LNAPL in these areas of the site appears to be at greater depth than observed in the southern portion of the site, tapering off to absent in the northern portion of the site.
A definitive determination of specific LNAPL products cannot be made from LIF data alone. Typically, the LIF data provide a basis from which targeted sampling plans can be developed for confirmation, along with examination of other available lines of evidence. In this case, Dakota worked with the client and regulators to determine optimal locations for targeted sampling that would provide samples necessary to determine with confidence whether the initial LIF waveform interpretation, the NNLS analysis, and the resulting 3D visualizations were correct.
Select LIF locations and depths were sampled and cores were examined whole at Dakota’s lab. Sub-samples were selected and sent to a forensic lab for analysis by USEPA Methods 8015M and 8270M. There was generally agreement between the a priori LIF NNLS CSM model and analytical lab results, with highlights being:
- Soil from 05-LIF (29.5-30.0’), shown on Figure 4, contained LNAPL as indicated by LIF, 66.5% diesel and 33.5% gasoline, supporting the “DIESEL” ID made in the field and assumed in the NNLS CSM
- Soil from 12-LIF (16.0-16.5’), shown on Figure 5, was found to contain LNAPL, 99% weathered gasoline, supporting the “GASOLINEWEATH” ID made in the field with LIF and assumed in the NNLS CSM; 12-LIF’s location just under the dispensers probably precluded it from receiving diesel from the assumed nearby AST release
- Soil from 20-LIF (36.7-37.0’), shown on Figure 3, contained LNAPL, 65% weathered gasoline and 35% diesel, semi-supportive of the “GASOLINEINTACT” interpretation in the field (NAPL was gasoline-dominated). The field interpretation and the NNLS CSM are in disagreement with the lab’s 35% diesel finding (the waveform and N2 purging studies showed little indication of diesel).
The total cost for the UVOST® site characterization was approximately $22,000, which includes the costs for mobilization, per diem payments, four days of UVOST operation, and direct-push technology rig operators and equipment. The cost for preparing the data visualization package and advanced data analysis (not described here) was approximately $8,500. The validation sampling and forensic analysis that resulted in confirmation of the CSM cost approximately $9,200. Costs can vary depending on the size of the site, the complexity of the data, and the desired visualization outputs.
While the cost of the UVOST® site characterization and data analysis process is significant, the real-time screening for the presence, distribution and classification of LNAPL at a scale-appropriate resolution provides key information in a multiple-lines-of-evidence approach to a comprehensive and adaptive assessment process. It should be noted that advanced analysis is not always necessary or even advised. Experienced UVOST practitioners often process the waveform types, false positives, and relative impacts intuitively in three dimensions without the need to perform advanced data analysis and computerized visualization.
9.5.1 Source Information
High Resolution Site Characterization Report – UVOST-EC Investigation, Dakota Technologies Company, LLC, April 18, 2018
Initial Response and Hazard Management Report, Southern Environmental Management & Specialties, Inc., November 20, 2012
Initial Site Characterization Report (ISCR), Southern Environmental Management & Specialties, Inc., March 28, 2013
Corrective Action Monitoring Report (CAMR), Southern Environmental Management & Specialties, Inc., October 4, 2018
Click here to download the entire document.

