
3.5 Cone Penetrometer Testing
CPT is used to characterize geologic (lithology) and hydrologic properties of the subsurface. It is generally applied to sites with unconsolidated lithology but may also be effective in soft rock. CPT is useful for characterizing sites with discrete horizons or discontinuous lenses. The detailed lithology provided by CPT may be used to identify zones of high or low permeability, further defining groundwater migration pathways and potential groundwater storage zones.
3.5.1 Tool Description
CPT is used to evaluate the stratigraphy, soil types, water table, and engineering parameters of the subsurface. Data are logged directly to a field computer and can be assessed in real-time by the on-site geotechnical engineer or scientist.
CPT uses the weight of the CPT truck to advance a 55° to 60° cone through the subsurface at a constant rate, usually 2 cm/sec. CPT probes vary in size, typically 10 cm2 to 15 cm2 (cone surface area). This technology is generally applied to depths up to 150 ft but has been used as deep as 300 ft. Penetration depth may be improved by using an expanded coupling behind the cone, which reduces friction on the rods by enlarging the borehole. CPT probes are designed for push-only applications and cannot be driven with a hydraulic hammer or other percussion methods, which may limit penetration depth in some settings. Greater penetration depths may be achieved by predrilling through intervals where CPT data are not needed or where subsurface conditions limit cone advancement.
A traditional CPT platform is a hydraulic ram mounted on a CPT truck; a string of 1-meter long threaded rod segments is used to push probes into the subsurface. The system includes the following components:
- an electrical penetrometer
- a hydraulic pushing system with rods
- cable or transmission device
- depth recorder
- piezoelectric element to measure pore pressure
- strain gauges to measure the tip resistance and sleeve friction
- data acquisition unit
Figure 3‑22 illustrates a typical CPT platform and system. Note the inclinometer on the probe to measure deviation from vertical, which should not exceed 2° (Robertson and Cabal 2008).
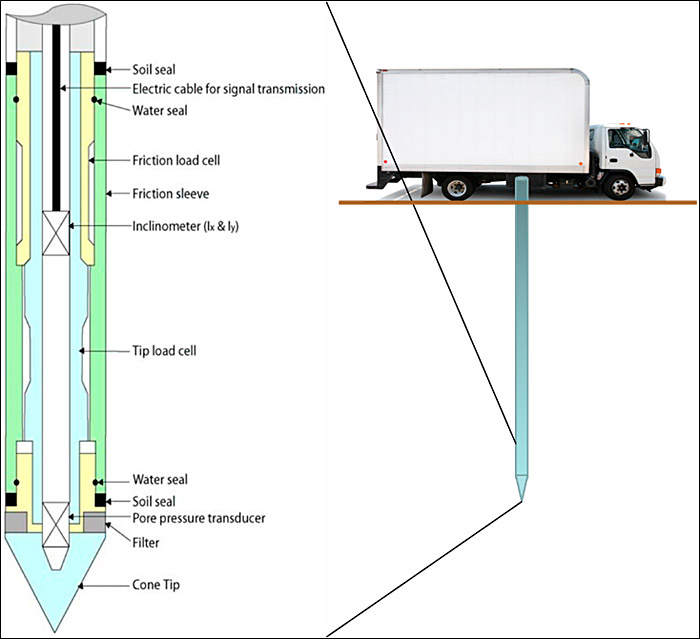
Figure 3‑22. Typical CPT configuration.
Source: Gregg Drilling & Testing, Inc. Used with permission
CPT measures tip resistance (qc) and sleeve friction (fs), typically at 1- to 5-cm intervals. Tip resistance is theoretically related to the undrained shear strength of a saturated, cohesive material and measured with an embedded load cell. The sleeve friction is theoretically related to the friction of the horizon being penetrated and measured using tension load cells embedded in the sleeve (USDA 2009). Generally, clay soils have high sleeve friction and sandy soils have high tip resistance; however, values are dependent on individual soils (ScienceDirect 2016).
Tip resistance and sleeve friction are often plotted as the friction ratio (Rf) to aid in interpreting soil type (for example, sand, silt, clay; see Figure 3‑23) based on various soil classification schemes (Robertson 1986); (Robertson 1990). CPT probes may also be equipped with a pore-pressure sensor[1] (Lunne, Robertson, and Powell 1997) to improve soil classification data. Dissipation tests conducted with a piezocone penetrometer (CPTµ) also assist in estimating approximate hydraulic head and soil permeability or hydraulic conductivity at the point of measurement (Robertson et al. 2011). A typical CPT log is shown on Figure 3‑24.
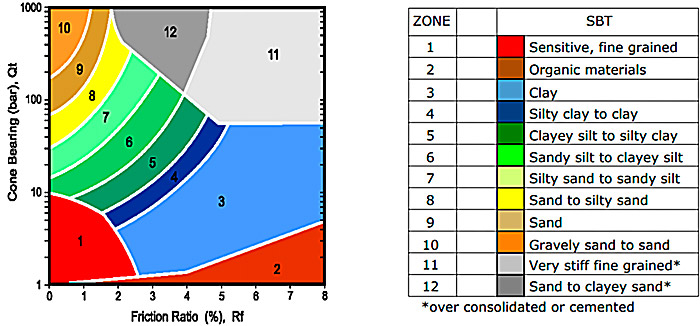
Figure 3‑23. Soil behavior types.
Source: Gregg Drilling & Testing, Inc. Used with permission
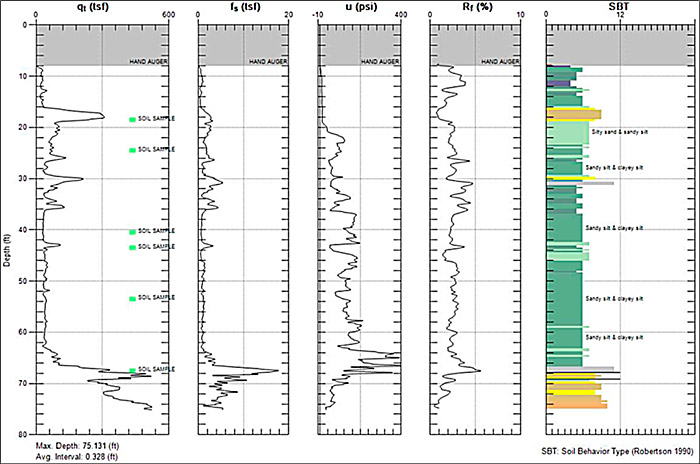
Total cone tip resistance (qt), sleeve friction (fs), friction ratio (Rf), pore pressure (u, pounds per square inch), Soil Behavior Type (SBT)
Figure 3‑24. Typical CPT log
Source: Gregg Drilling & Testing, Inc., Used with permission
3.5.2 Technical Limitations
Similar to other direct-push technology methods, CPT use is limited to sites with unconsolidated lithology and possibly in soft rock. After the CPT drill rods are removed, an open borehole may remain. This borehole should be sealed as soon as practicable to reduce the likelihood of cross contamination. To avoid this situation and minimize borehole cross contamination, retraction grouting may be performed as drill rods are removed.
When using CPT, soil behavior types may present an ambiguous representation when soil properties are nonstandard (for example, very dense/stiff soil), and omit grain-size information. These soils may have both elevated tip resistance and sleeve friction values and are not always handled accurately by the algorithm that calculates the soil behavior type. Experience suggests that dense fine-grained sand, for example, may be identified this way.
3.5.3 Quality Assurance and Quality Control (QA/QC)
CPT soundings should be performed in accordance with (ASTM 2012a). CPT sensing devices should be properly calibrated using reference standards or by identifying readings considered reasonable by an experienced technician. Baseline readings should be measured before and after each sounding to assess measurement stability and consistency. Additional details are provided in the sections below.
3.5.3.1 Quality Assurance Prior to Use
Site conditions and objectives should be evaluated to determine the applicability of the CPT on site. Prior to use, the lithology to be penetrated, potential interferences, and potential refusal depth must be evaluated to the extent practicable.
3.5.3.2 Quality Control During Use
Progress should be carefully observed, and the screens should be viewed while advancing CPT tooling. The advancement (push) rate must be monitored for deviations to account for associated response variations; the rate should not exceed method specifications. Slower advancement rates produce higher data densities, with minimal risk to data quality, but reduce daily production.
3.5.3.3 Quality Control After Use
Targeted follow-up sampling (when data suggest the need) and comparison to existing logs, if available, may be used to validate CPT output. The results of dissipation tests and pore-pressure readings may require assistance from the CPT vendor for interpretation.
3.5.4 Tool and Data Misuse
CPT results should not be interpreted without understanding the CSM and, if available, other lines of evidence. CPT does not provide grain-size information, and soils that do not conform to the expected behavior types may be misinterpreted.
3.5.5 Supporting and Enhancing Instruments and Technologies
The following tools, also described in this section, may be paired with CPT to provide additional types of data:
- MIP (see Section 3.2 for a detailed description)
- OIP (see Section 3.3 for detailed description)
- LIF (see Section 3.4 for a detailed description)
- HPT (see Section 3.6.1.1 for a detailed description)
- EC arrays (see Section 7 for a detailed description)
Other sensors and tools that can be combined with CPT include the following (Cabal and Robertson, 2008):
- temperature – to identify frozen soil or contaminants that generate heat
- resistivity – to evaluate lithology and chemistry
- pH – to identify contaminants
- redox potential – to assess subsurface conditions undergoing bioremediation
- radioisotopes – to measure density and moisture content or to detect radioactive contaminants
3.5.6 Case Studies
The following case study demonstrates how CPT can be applied at sites:
[1] A CPT cone equipped with a pore pressure sensor is refered to as a piezocone and CPT test using a piezocone is often abbreviated as CPTµ).
Click here to download the entire document.

