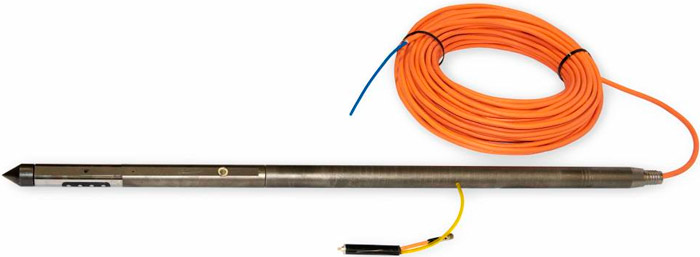
3.6 Hydraulic and Groundwater Profiling Tools
Hydraulic and groundwater profiling tools are a group of injection flow logging tools with the primary purpose to measure relative permeability or actual hydraulic conductivity. The advantage of hydraulic and groundwater profiling tools is that they are capable of collecting a high density of quantitative groundwater data. They can be used independently or in combination with other screening and sampling tools on a single tool string. Some versions of these tools also perform discrete interval groundwater sampling. These tools are used in conjunction with a direct-push platform and include the following:
- HPT – an injection-flow logging tool that measures pressure, flow, hydraulic conductivity, and soil and groundwater EC and can be used alone or integrated with MIP, OIP, and LIF
- Waterloo APS – an integrated injection-flow logging and discreet interval groundwater sampling tool that measures pressure, flow, and hydraulic conductivity
- HPT-GWS – an integrated injection-flow logging and discreet interval groundwater sampling tool that measures pressure, flow, hydraulic conductivity, EC, and groundwater-specific EC and operates similar to the Waterloo APS
- HPT-GWP – a smaller version of the HPT-GWS tool that measures injection pressure and flow and collects discrete groundwater samples but does not include the EC or downhole pressure sensor
These multipurpose tools generate real-time logs of formation permeability while advanced through the subsurface. The tools operate in unconsolidated formations, generally to depths of 100 ft below ground surface. The value of these tools is the dataset generated, which allows contaminant mass relative to formation permeability to be understood and groundwater storage zones and flow zones to be identified.
The primary benefits of hydraulic and groundwater profiling tools are that they:
- Optimize site assessment and remedial efforts by providing a high-resolution, real-time depiction of formation permeability, including potential contaminant flow pathways and potential confining layers, which can be used to optimize well and well screen placement.
- Identify the water table, infer lithology, identify confined or semiconfined aquifers, and estimate hydraulic conductivity in the saturated zone.
- Integrate with MIP, OIP, or LIF, understand the depth and distribution of contaminant mass relative to formation permeability, and infer relative mass flux.
- Collect discrete groundwater samples from a short-screen interval (2 inches to 6 inches), based on the evaluation of the formation permeability to generate quantitative groundwater analytical data.
- Rapidly characterize site contaminant impacts and hydrogeologic conditions without installing permanent monitoring wells.
3.6.1 How the Tools Work
Hydraulic and groundwater profiling tools are typically operated by trained professionals employed by a drilling company or other specialty vendor. No specific training is required for an environmental professional to use these tools, but it is recommended that a scientist familiar with site geology oversee tool operation to direct the contractor where to terminate borings and collect samples (if applicable) and assist the operator with the interpretation.
Injection-flow logging tools measure the pressure required by a water pump to inject a flow of clean water (generally dclean tap water) into the soil, through small screen port(s) on the side of the tool, as the probe is advanced into the subsurface. The tool produces a graphical log of injection pressure and flow with depth, which can be used to infer formation permeability and to calculate semi-qualitative values of hydraulic conductivity with depth. Injection flow logging is useful for understanding the heterogeneity of formation permeability, which often varies over short vertical, and to a lesser extent, horizontal distances.
The sampling version of these tools (HPT-GWS, HPT-GWP, and Waterloo APS) combine injection-flow logging with discreet interval groundwater sampling. Because the groundwater samples collected are analyzed using traditional laboratory techniques, these tools are not limited to detecting a certain type of contaminant. Deionized injection water may be required for certain applications, such as metals analysis, for purging the sampling lines prior to sampling. Once groundwater samples are evaluated by a laboratory, the collective dataset includes formation permeability and quantitative groundwater analytical data.
Together, hydraulic and groundwater profiling tools are capable of generating a powerful dataset that can be used to understand contaminant mass in relation to formation permeability.
3.6.1.1 HPT
The HPT is an injection-flow logging tool manufactured by Geoprobe Systems® that measures the pressure required to inject a flow of water into the soil as a probe is advanced into the subsurface. The downhole components of the tool consist of the following (see Figure 3‑25):
- probe equipped with an injection screen port and EC array
- injection and hydrostatic pressure sensor
- trunk line consisting of electrical wires and a water-injection line
- connection tube and drive head with the pressure sensor, electrical wires, and water-injection line
- probe rods (1.75- or 1.5-inch-diameter rods are typically used, successive rods are added as the probe is advanced with depth)
Figure 3‑25. Downhole probe components of the HPT (The pressure sensor is shown outside of the connection rod but is actually located inside the rod during use).
Source: Geoprobe Systems®, Used with permission
The aboveground components of the tool look similar to the instruments shown in Figure 3‑6 and consist of:
- data acquisition instrument – measures EC and acquires data from other instruments (such as MIP) if the HPT is being used in conjunction with another tool
- computer – receives data from acquisition instrument, displays logs and saves all data and operating parameters
- controller – regulates the flow of injected water and measures injection pressure to the HPT trunk line and probe
The injection-pressure log produced by the HPT is an indicator of relative formation permeability; higher injection pressures correspond to lower formation permeability (silts and clays) and lower injection pressures correspond to higher formation permeability (sands and gravels). The HPT operates by continuously injecting water as the tool advances, which creates a real-time log of average HPT pressure and flow at depth.
Following completion of the boring, HPT pressure data is corrected at each depth interval using a graph of absolute hydrostatic pressure, which is calculated from a dissipation test. The corrected HPT pressure graph can be used along with the HPT injection flow rate to calculate and plot estimated hydraulic conductivity (McCall 2010). Additional information about calculating estimated hydraulic conductivity is provided in (McCall 2010). The correction equation is:
Corrected HPT Pressure = Average HPT Pressure – Absolute Hydrostatic Pressure
To conduct a dissipation test, the operators identifies a depth below the water table to temporarily pause tool advancement and pause injection of water. At the selected depth, the operator turns off the water pump which allows the pressure of the ambient formation to dissipate until it reaches the hydrostatic head at the depth of the tool. Typically, the pressure-dissipation tests should be completed in relatively high-permeability zones to allow full dissipation of ambient formation pressure over a relatively short duration of time.
Figure 3‑26 provides an example HPT log showing:
- average HPT pressure in pounds/ square inch (psi) (red line in second column in Figure 3‑26)
- corrected HPT pressure in psi (purple dashed line in first column in Figure 3‑26)
- average flow in mL/minute (green dashed line in fourth column in Figure 3‑26)
- estimated hydraulic conductivity in ft/day (blue line in fourth column in Figure 3‑26)
As shown on Figure 3‑26, injection-flow logging from the HPT can be combined with EC (black line in first column) as well as screening tools such as the MIP. The two tools are integrated and advanced into the subsurface together, creating an output log showing both formation permeability data from the HPT and screening data from the MIP (MiHPT log). Figure 3‑26 also shows MIP data as the orange and blue lines in the third column.
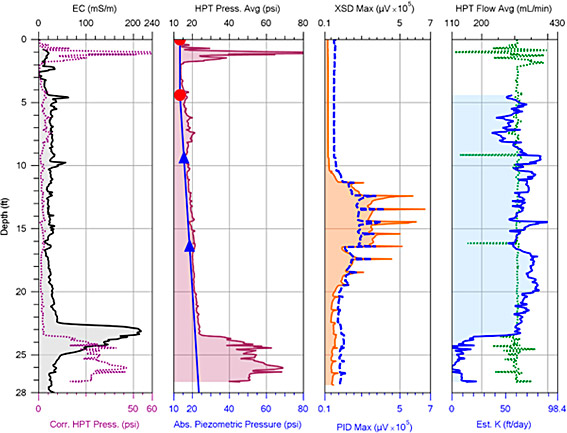
Figure 3‑26. Example MiHPT log.
Source: Geoprobe Systems®, Used with permission
3.6.1.2 Waterloo Advanced Profiling System
The Waterloo APS is an integrated injection-flow logging and discreet interval groundwater sampling tool that is driven into unconsolidated soils using direct-push rods. It is a proprietary tool currently operated by Cascade Technical Services. The tool was developed and tested extensively at the University of Waterloo and was introduced to investigation and remediation professionals in 1994.
The downhole components of the Waterloo APS (see Figure 3‑27) are:
- profiler tip consisting of a drive point with stainless-steel screened ports
- conventional direct-push rods
- up to three stainless-steel lines running through the drilling rods and connecting the profile head to the ground surface:
- KPRO line – injects water at a constant rate (typically 300 mL/min) into the subsurface
- sample line – conveys groundwater up through the drill rods to the surface via peristaltic or gas drive pump
- gas line – conveys nitrogen to operate the downhole pump
- nitrogen gas positive displacement pump for when the water table is below the suction limit of a peristaltic pump
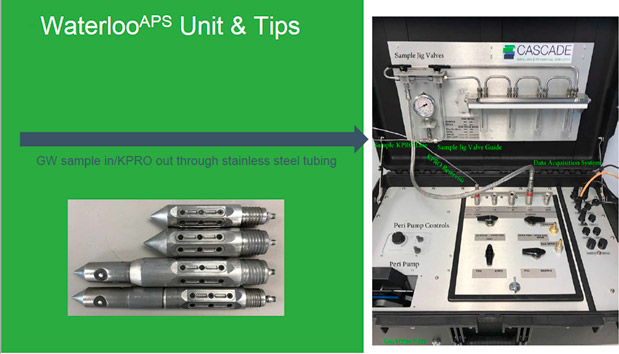
Figure 3‑27. Waterloo APS tool tip options and instrument.
Source: Cascade Environmental, Used with permission
The aboveground components of the tool are:
- peristaltic pump
- multiparameter water-quality meter used to measure pH, temperature, oxidation-reduction potential (ORP), electrical conductivity, and turbidity of purged groundwater
- sensor and laptop computer equipped with software to measure and log the index of hydraulic conductivity, which is the pressure required to inject a flow of water into the subsurface
The injection-flow logging component of the tool operates similar to the HPT except that the tool logs relative formation permeability in real-time; dissipation tests are not completed, and the index of conductivity data is not corrected. Typically, the index of conductivity data is evaluated in real-time by the operator and are used to infer hydrogeologic conditions to determine sample depth. In relatively high-permeability formations such as sands and gravels, less pressure is required to inject into the subsurface; in relatively low-permeability formations such as silts and clays, more pressure is required to inject into the subsurface. The operator or consultant reviews the real-time log of relative formation permeability and directs the driller to stop advancing once the profile tip is at the target depth or within the target unit.
To collect a groundwater sample, drilling temporarily stops and groundwater is purged to the surface via a peristaltic or gas-drive pump and is monitored for geochemical parameters to determine stability (see Figure 3‑28). Once stabilization is achieved, samples are collected for laboratory analysis and the profiler tip is advanced to the next targeted sample depth. The Waterloo APS is commonly fitted with a stainless-steel sample holder used to collect zero-headspace groundwater samples in 40 mL VOA vials, but the tool can be used to collect any type of groundwater sample.
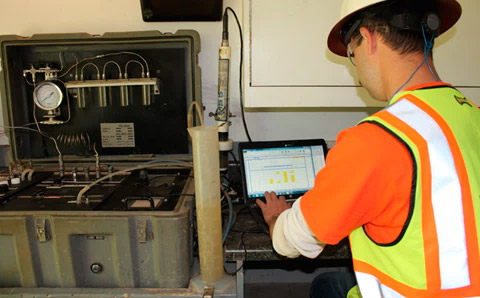
Figure 3‑28. Waterloo APS operator purging groundwater from the sample interval, recording water-quality parameters, and preparing for sample collection.
Source: Cascade Environmental, Used with permission
The Waterloo APS profiler tip is available in three sizes (2.25 inch, 1.75 inch, and 1.50 inch) and is attached directly to the direct-push rods used on the direct-push drilling platform. The larger diameter tip is used on a larger drill rig for maximal depth penetration and higher sampling rates; the smaller tip is used with smaller drill rigs to access tighter spaces where larger drill rigs cannot operate.
3.6.1.3 Hydraulic Profiling Tool – Groundwater Sampler (HPT-GWS)
The HPT-GWS combines the injection-flow logging of the HPT with discreet interval groundwater sampling and operates in a similar manner as the Waterloo APS. The HPT-GWS is designed for use on a 2.25-inch-diameter casing for advancement into the subsurface using direct-push methods (see Figure 3‑29). The tool components are generally the same as the HPT described in Section 3.6.1.1, with the addition of a ¼-inch-outer-diameter sample line. The probe tip is equipped with 20 screened ports, each about ½-inch in diameter, installed in four rows around the probe circumference. The ports are distributed over a 4-inch vertical segment of the probe, providing for a discrete sample interval. Ten of the 20 screened ports are visible in Figure 3‑29.
As with the HPT, a pressure transducer located just above the injection ports measures the pressure required to inject the water into the formation. This pressure is logged by uphole instrumentation. An EC array is positioned at the end of the probe to provide a log of bulk formation EC, and the EC and injection pressure are logged every 0.05 ft (about15 mm) of log depth. The log data guide selection of permeable zones for sampling; once the HPT-GWS has reached a desired sampling depth, advancement of the tool pauses temporarily, and the operator may conduct a dissipation test prior to sampling. To sample, groundwater is purged through the sample line using either a peristaltic or a bladder pump, depending on aquifer conditions. Following sample collection, the operator resumes HPT logging and the tool is advanced to the next sample depth.
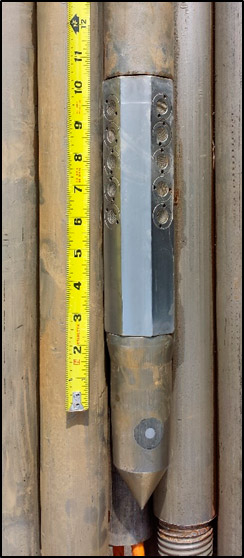
Figure 3‑29. The HPT-GWS probe.
Source: Geoprobe Systems®, Used with permission
The Waterloo APS and the HPT-GWS are both operated by a trained operator, who is typically a geologist that works for the drilling company. As such, no specific training is required for an environmental professional to use the tool, but it is recommended that a scientist familiar with the site geology oversee the tool operation to direct the operator where to sample.
3.6.1.4 Hydraulic Profiling Tool – Groundwater Profiler (HPT-GWP)
The HPT-GWP is a smaller diameter (1.75 inch) version of the HPT-GWS, which lacks the EC dipole and downhole pressure transducer. It measures injection flow and pressure (surface pump pressure) and has the 20-screen port arrangement for collecting groundwater samples at discrete intervals. Compared to the HPT-GWS, it is a simpler and more robust design because it only has two water lines. The HPT-GWP is used to collect multiple discrete groundwater samples from predetermined intervals.
3.6.2 Technical Limitations
The technical limitations associated with hydraulic and groundwater profiling tools are associated with applicability and accessibility such as formation permeability, tip clogging, and freezing conditions. These limitations are described in the subsections below.
3.6.2.1 Formation Permeability
The HPT system is able to resolve soil permeability within a hydraulic conductivity range of about 0.1 ft/day (3.5 x 10⁻⁵ cm/sec) to 75 ft/day (2.7 x 10⁻² cm/sec), approximately three orders of magnitude in range. The lower end of the range varies depending on flow rate, effective pressure, and the specific nature (density, grain size, moisture content) of the soil or sediment being penetrated. At the upper end of the range, formation permeability becomes sufficiently high to reduce the pressure required to inject fluid into the formation to relatively low. Under high hydraulic conductivity conditions, the injection pressure may be equal to or less than the pressure resulting from the internal friction due to fluid flow in the HPT probe. Under these conditions, the hydraulic conductivity of the formation is effectively above the upper limit of what the HPT can discern. Simply increasing flow rate to the probe does not alleviate this problem; it also increases the internal friction and pressure. In aquifer zones where the estimated hydraulic conductivity is near the upper limit, temporary piezometers (Geoprobe 2006); (Geoprobe 2010); (ASTM 2012b) can be installed across these intervals and slug tests (Geoprobe 2014); (ASTM 2013) can be performed to more precisely define higher hydraulic conductivity zones.
The HPT probe is currently designed with a 100 psi (about700 kilopascal) pressure transducer (equivalent to about 230 psi of water pressure). The effective upper operating limit is about 80 psi (550 kilopascal) or about 180 ft (about 55 m below the water table in an unconfined aquifer.
The Waterloo APS has a similar upper limit for differentiating relative formation permeability within high-permeability zones. Due to this upper limit, the index of conductivity log may not be able to differentiate between the most permeable zones, such as a coarse sand and gravel.
For all hydraulic and groundwater profiling tools, sample collection is limited by formation permeability because groundwater samples cannot be collected unless there is sufficient groundwater flow within the formation. Unlike a monitoring well, which can sometimes be sampled under low-recharge conditions (for example, purging the well dry and returning later to collect a sample), a groundwater sample cannot be collected unless there is sufficient flow. That said, if a particular depth interval does not produce sufficient flow for sample collection, it can be inferred that mass flux within that zone would be relatively low. Then, the tool can be advanced deeper to collect samples from subsequent depth intervals.
3.6.2.2 Tip Clogging
In silty geologic conditions, the HPT screen ports may clog, preventing sample collection. To unclog, the tool typically has to be removed from the hole to remove the clog from the tip. Additionally, the tip may clog when advancing through a viscous DNAPL.
3.6.2.3 Freezing Conditions
Groundwater profiling tools can be challenging to operate in subfreezing conditions because the injection-flow-logging component of the tool relies on a steady flow of water from the surface to the subsurface, and the profiling component of the tool requires groundwater to be pumped back up to the surface. In subfreezing conditions, tubing may freeze and prevent water flow in either direction. Heated tents can be used when profiling in subfreezing conditions, but additional health and safety precautions must be taken and productivity will likely be slower.
3.6.3 Quality Assurance/Quality Control
QA/QC standards must be established and followed to ensure reliable data. In addition to comprehensive operator training (which may be verified prior to commencing work) and an operator track record of successful use, approved field procedures must be understood and followed before, during, and after profiling activities. The manufacturer’s SOP must be reviewed prior to initiating field work.
3.6.3.1 Quality Assurance Prior to Use
Prior to beginning investigation activities, the operator should calibrate and test hydraulic and groundwater profiling tools. Depending on the tool, testing may be conducted daily during a field program or at the beginning of each boring. The project team should ask the operator about the QC procedures specific to the tool and request that testing and calibration results be communicated to the field team and included within the final data report.
3.6.3.2 Quality Control During Use
Once data collection has begun, the operator must monitor the equipment throughout the data collection process. For most hydraulic and groundwater profiling tools, the operator monitors the rate of advancement, depth, EC, and injection pressure to ensure equipment responses are within normal ranges. Maintaining a constant rate of advancement (typically around 2 cm/sec) produces a representative log; a slower rate gives a more detailed log but affects the rate of production. A rate that is too fast can miss smaller stratigraphic features. Daily productivity varies greatly depending on desired drilling depth and the number of times that drilling is stopped to either complete a dissipation test (if applicable) or collect a sample for laboratory analysis (if discreet interval samples are being collected). Generally, with the profiling tools, the factor that limits productivity is the number of samples collected per day for laboratory analysis.
Prior to beginning work, the depth of the local water table from a nearby well or temporary piezometer should be estimated as it is not always evident from the pressure injection log. Understanding the approximate depth of the water table helps the operator interpret the injection pressure log and generated contaminant screening data. If the tool is being used to collect discreet interval groundwater samples (Waterloo APS or HPT-GWS), the water table depth must be estimated to direct the depth at which sampling can begin.
For sampling tools, some trial and error may be necessary to determine the site-specific conditions under which groundwater samples can be efficiently collected. Sample flow may be directed through an in-line flow-through cell with a multiparameter water-quality meter and a sample interval is purged until stabilized criteria are met, which typically involves purging 400 mL to 1,000 mL. If deionized water is used for the injection fluid, a good contrast between the natural formation water and the deionized water is easily observed with the water-quality meter. If a water-quality meter is not being used, three system volumes should be purged before collecting samples for laboratory analysis.
After sample collection, sample-specific tubing is changed. Following completion of a boring, the drill rod, stainless-steel tubing, and profiling probe or tip is decontaminated between each profiling point with clean water or by following project-specific decontamination procedures.
3.6.3.3 Quality Controls After Use
Depending on investigation objectives, co-located groundwater and soil samples may be collected following completion of a hydraulic and groundwater profiling investigation to make defensible statements regarding the accuracy and precision of the data collected. For example, if HPT or index of conductivity (IK) logs are being used to inform remedy design, it may be important to advance targeted soil borings within the low permeability zones where contaminant mass is retained to correlate injection pressure log data to a specific soil type. In another scenario, soil analytical samples may be collected to determine contaminant mass within the low permeability layers where groundwater samples have not been collected.
The investigation may also be supplemented with a select number of permanent monitoring wells if multiple rounds of groundwater data from a monitoring well are required for risk characterization or site closure. In this case, the hydraulic and groundwater profiling investigation can significantly reduce the scale and cost of the monitoring well network by informing the well network design so that screens are placed within specific hydrogeologic units identified by the hydraulic and groundwater profiling investigation.
3.6.4 Data Interpretation and Presentation
Logs provided by the contractor are often grouped together to form cross sections. The vertical variations in formation permeability are correlated horizontally and shaded to help the reader visualize the geologic strata. Laboratory analytical data are added to the cross section.
Boring log data provided by the contractor can be requested in spreadsheet format and input into visualization and modeling programs such as Earth Volumentric Studio (EVS), ArcGIS, or LeapFrog so that cross sections or 3-D visualization models can be created using other software programs as needed.
As site characterization progresses, additional types of data can be added to the cross sections, including monitoring wells and associated groundwater analytical data and soil borings and associated soil analytical data.
3.6.5 Data Misuses
Samples collected from groundwater profiling tools are different from traditional monitoring well screen samples because they are collected from a much smaller discreet interval. Samples from a 5- or 10-ft-long submerged well screen can originate from multiple lithological zones within the screened interval. These zones may exhibit different contaminant concentrations. Therefore, monitoring well data may represent a weighted-average concentration within the screened interval, which is often less reliable when developing a CSM. Weighted-average concentrations within a screened interval should not be compared directly to discreet intervals sampled by profiling tools without considering the potential dilution factors within the screened interval of the monitoring well.
3.6.6 Supporting and Enhancing Instruments and Technologies
An EC array is standard equipment on most profiling tools. EC is discussed in detail in Section 3.7.
3.6.7 Case Studies
The following case study demonstrates how hydraulic and groundwater profiling tools can be applied at sites:
- CPT Borings and Hydropunch Sampler Optimize Site Characterization at Naval Air Station North Island in California
- Waterloo APS, CPT, and LIF Data Update CSM and Help Optimize Selected Remedy at a Former Refinery in Oklahoma
Click here to download the entire document.

