
9.3 OIP-Green Probe Delineates Extent of Coal Tar NAPL at a Former Gas Manufacturing Plant in Kansas
| Wesley McCall, P.G. Geoprobe Systems®, Salina, KS [email protected] |
Jonathan L. Stephenson, I.G. Environ. Spec. KDHE BER Orphan Sites Unit, Topeka, KS [email protected] |
The former Wellington manufactured gas plant was constructed around 1896 and operated until 1906. In the 1910s the community converted the closed plant into its first community park. Due to a tight community budget, municipal waste was used to backfill the gasholder (shown in Figure 9‑8) prior to construction of the park. The backfill created a significantly heterogeneous subsurface (VanDeventer n.d.). Currently, the plant building operates as a local railroad museum, with school children from across the area visiting the museum several times each year.
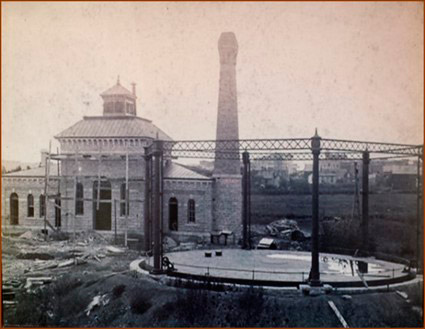
Figure 9‑8. Wellington former manufactured gas plant under construction circa 1896. Gas holder in right foreground and plant building at left
Environmental investigations at the facility began as early as 1993 and have continued intermittently until the present. Dozens of soil samples from multiple borings have been analyzed for PAHs and other contaminants. Contaminants detected in soils include naphthalene and benzo-a-pyrene. Shallow and deep nested monitoring wells were installed at 12 locations across the site and coal tar DNAPL has been observed in at least three of the wells located between the former gas holder and the plant building (KDHE 2014a); (KDHE 2014b). Thickness of DNAPL observed in the wells has ranged from a trace to one foot. nd areas where coal tar contamination was present.
In March of 2011, nine trenches were excavated with a backhoe to assess contaminant distribution (KDHE 2014b). Several of the trenches encountered a “black, wet oily waste” and analysis of one such sample contained 22,800μg/kg benzo-a-pyrene and a total PAH load of 617,790 μg/kg. KDHE decided that additional information on coal tar NAPL distribution was needed to better assess remediation/removal options for this facility. KDHE then coordinated with Geoprobe to run logs with the recently developed OIP-G probe to assess the distribution of coal tar NAPL to better characterize the site and guide remedial actions.
The OIP-G probe was used to assess the distribution of coal tar NAPL. This direct-push probe is designed with a green (525 nm) laser diode to induce fluorescence of coal tars and creosote. The green light illuminates the soil through a sapphire window on the side of the probe. A small CMOS camera mounted behind the window captures images of the fluorescent light. The images are analyzed by the OIP software to provide a digital log of percent area of fluorescent versus depth as the probe is advanced at 2 cm/sec. An EC dipole also provides a log of bulk formation EC to evaluate lithology.
Log locations were selected based on previous site data and to fill data gaps (see Figure 9‑9). Thirty-four OIP-G logs were obtained with depths between about 25 ft to 30 ft.
Historical reports indicate the gas holder was 15-25 ft deep. Drilling determined the actual depth to be 16.5 ft (Burns & McDonnell 2004). The OIP log completed within the gas holder showed the gasholder’s base had been structurally compromised, with contamination (fluorescence) being logged to a depth of 25ft.
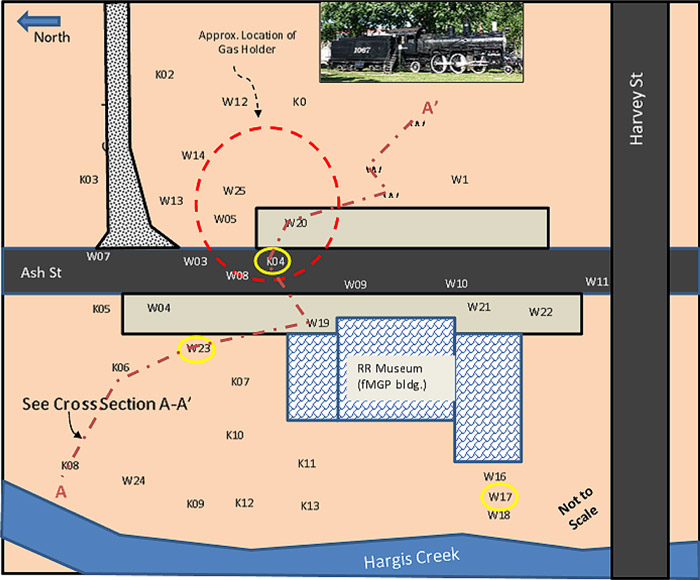
Figure 9‑9. Site sketch map with log and cross section locations.
Log K04 showed high fluorescence levels between about 13 ft to 20 ft below ground surface (see Figure 9‑10). A soil core sample was collected from 13.5 ft to 17.5 ft at this location. Coal tar DNAPL was poured out of the soil liner into a 4-oz. jar before subsampling the soil for analysis. The soil sample analysis revealed a total PAH load of 6,016,000 µg/kg. Log W23 (see Figure 9‑10) showed high EC spikes in the upper 10 ft indicating the presence of buried metal. Log W23 also showed several zones of elevated fluorescence. A soil core was collected from 9 ft- to 11ft interval and submitted for analysis. The results revealed a total PAH load of 2,724,000 μg/kg.
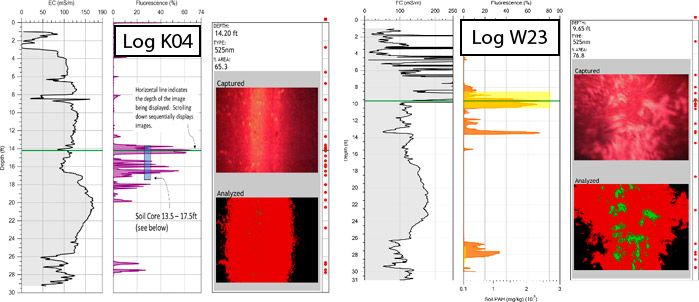
Figure 9‑10. K04 and W23 logs.
Many of the EC logs displayed lower EC near the middle of the formation (for example, about 14 ft to 17 ft in log K04) and then again just above the shale bedrock (for example, about 26 ft to 28 ft in log K04). Samples collected across these low EC intervals typically had a higher sand and gravel content and were therefore more permeable. High fluorescence readings were often observed in the lower EC zones, especially just above the shale bedrock. A cross section of logs (see Figure 9‑11) reveals a high EC zone near the middle of the formation. Samples from these zones revealed the soils to be a low permeability, silty clays. Gray shading in Figure 9‑11 also shows total PAH results from soil samples collected at those approximate depths. Orange shading in Figure 9‑10 represents percent fluorescence from 0% to 90%. The cross section also shows that the coal tar NAPL typically lies above and below the low permeability zone, as indicated by elevated fluorescence levels. (McCall, Christy, Pipp, Jaster, Bean, et al. 2018). Confirmation sampling verified that fluorescence observed by the OIP-G successfully identified coal tar contamination at multiple locations across the area investigated. Cross sections with the logs were able to provide a clear guide to the distribution of coal tar NAPLs.
This project cost KDHE approximately $30,000 in mobilization, and Geoprobe operating costs during two assessment events. Approximately 1,733 ft of OIP-G logging was completed and 40 soil samples were collected for PAH analysis at depths of up to 30 ft. Geoprobe provided expertise, training, and the OIP-G tool, which assisted in reducing costs.
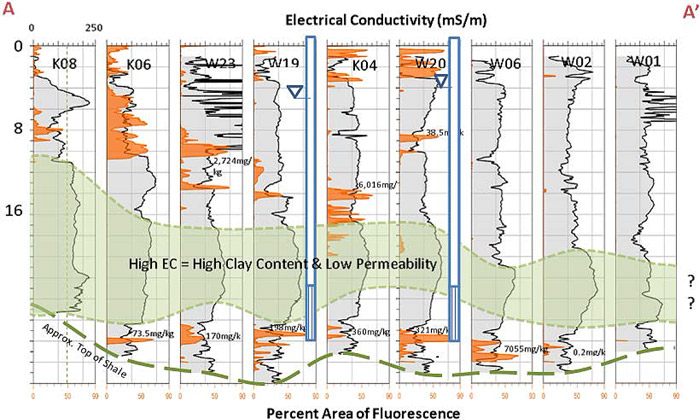
Figure 9‑11. Cross section A – A’ (see Figure 9‑9 for location; not to scale).
The advantages of using OIP-G at this location were as follows:
- The ability to simultaneously run an EC log to assist with lithology interpretation while obtaining the fluorescence logs
- Facilitation of real-time decision-making regarding sampling locations based on fluorescence log
- Ability to identify sampling intervals while in the field, reducing the number of samples requiring lab analysis
- compared to conventional core sampling and trenching methods, reduced investigation-derived waste on the order of 95%, which also reduced worker exposure.
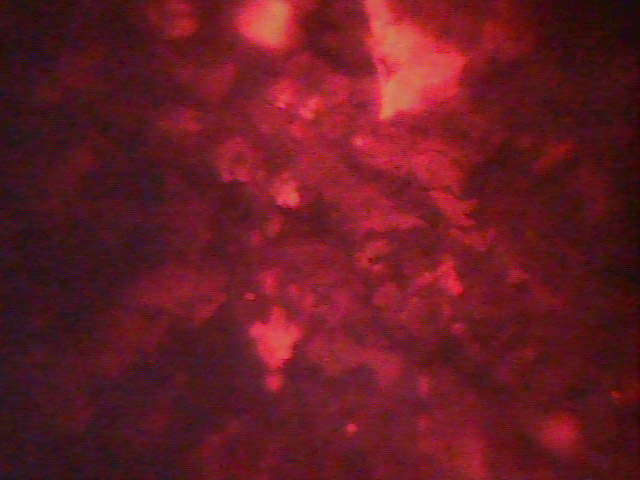
Figure 9‑12. Red-orange fluorescence of calcareous minerals observed under green (525 nm) source light.
The biggest disadvantage of this tool is that it can produce false positives in fluorescence if there are calcareous materials present in the path of the probe. At this site, elevated fluorescence (about 40%) in the red-orange wavelength typical of coal tar was observed at locations W17 and W18 (see Figure 9‑12). Soil coring results showed no coal tar contamination at these locations but light-colored particles were observed in the soil. A test with dilute hydrochloric acid produced effervescence, indicating calcite/limestone. Calcite is known to fluoresce. It is thought that limestone-based sand and gravel may have been used as fill material along the stream bank at this location. Similar fluorescence was observed from small caliche nodules present in the soil. Geoprobe is attempting to reduce the false positive problem by using an infrared LED to differentiate between dark-colored contaminants and light-colored minerals. In the meantime, targeted soil sampling may be required to verify the cause of fluorescence.
Click here to download the entire document.

