• Skip to main content
itrc_logo

Implementing Advanced Site Characterization Tools

Home
About ITRC
Navigating this Website
1 Introduction
1 Introduction Overview
1.1 Purpose and Scope
1.2 Technologies
1.3 How to Use this Document
2 ASCT Implementation
2 ASCT Implementation Overview
2.1 Tool Selection
2.2 Tool Application
3 Direct Sensing
3 Direct Sensing Overview
3.1 How to Select and Apply Direct Sensing Tools Using this Document
3.2 Membrane Interface Probe
3.3 Optical Image Profiler
3.4 Laser-Induced Fluorescence
3.5 Cone Penetrometer Testing
3.6 Hydraulic and Groundwater Profiling Tools
3.7 Electrical Conductivity (EC) Probe
3.8 Flexible Liners
4 Borehole Geophysics
4 Borehole Geophysics Overview
4.1 How to Select and Apply Borehole Geophysical Tools Using this Document
4.2 Fluid Temperature
4.3 Fluid Resistivity
4.4 Mechanical Caliper
4.5 Optical Televiewer
4.6 Acoustic Televiewer
4.7 Natural Gamma Logging
4.8 Borehole Flow Meters
4.9 Advanced Borehole Logging Tools
5 Surface Geophysics
5 Surface Geophysics Overview
5.1 How to Select and Apply Surface Geophysical Tools Using this Document
5.2 Electrical Resistivity Imaging
5.3 Ground Penetrating Radar
5.4 Seismic Methods
5.5 Electromagnetic Surveys
6 Remote Sensing
6 Remote Sensing Overview
6.1 How to Select and Apply Remote Sensing Tools Using this Document
6.2 Drones
6.3 Visible Spectrum Camera
6.4 Camera Features
6.5 Photogrammetry
6.6 Sample Collection and Monitoring using Drones
6.7 Cost Considerations
6.8 Case Studies
7 Stakeholder and Tribal Perspectives
8 Regulatory Perspective
8 Regulatory Perspective Overview
8.1 Challenges and Solutions
9 Case Studies
9 Case Studies Overview
9.1 MIP Boring Data Allow On-Site Decisions to Fill Data Gaps and Reduce Uncertainty during Triad Approach Evaluation at Five South Dakota Sites
9.2 MIP Allows Real-Time Identification and Delineation of DNAPL Plume at a Former Naval Air Station in California
9.3 OIP-Green Probe Delineates Extent of Coal Tar NAPL at a Former Gas Manufacturing Plant in Kansas
9.4 LIF Survey with UOVOST® Provides More Accurate Representation of LNAPL Plume at a Former Bulk Petroleum Storage Facility in New Hampshire
9.5 UVOST Differentiates LNAPL Types to Allocate Financial Liabilities at a Retail Petroleum Facility in Tennessee
9.6 TarGOST Determines DNAPL Extent and HPT Confirms Site Lithology at a Former Creosote Facility in Louisiana
9.7 CPT Borings and Hydropunch Sampler Optimize Site Characterization at an Aviation Industrial Complex in California
9.8 Waterloo APS, CPT, and LIF Data Update CSM and Help Optimize Selected Remedy at a Former Refinery in Oklahoma
9.9 Conceptual Site Model Development Using Borehole Geophysics at the Savage Municipal Water Supply Superfund Site in New Hampshire
9.10 ERI Provides Data to Improve Groundwater Flow and Contaminant Transport Models at Hanford 300 Facility in Washington
9.11 Surface and Borehole Geophysical Technologies Provide Data to Pinpoint and Characterize Karst Features at a Former Retail Petroleum Facility in Kentucky
9.12 GPR Data Show Location of Buried Debris and Piping Associated with a Former Gas Holder in Minnesota
9.13 Resistivity, Seismic Exploration, and GPR Provide Data to Evaluate Clay Reserves at a Commercially Mined Pit
9.14 Seismic Refraction, Electric Resistivity, and Multichannel Analysis of Seismic Waves Provide Data to Locate Monitoring Well Locations in a Mixed-Use Area in Northern Virginia
9.15 Surface Geophysical Methods Provide Data to Identify Prospective Utility Waste Landfill Sites in Karst Terrain in Missouri
9.16 Airborne Time-Domain Electromagnetic Method Maps Sand Distribution along the Illinois Lake Michigan Shore
9.17 Drone Technology Expedites and Streamlines Site Characterization at a Former Golf Course in Missouri
9.18 High-Resolution and Thermal Aerial Images Identify Mine Openings at an Abandoned Colorado Mine
9.19 RPAS Collects Water Samples to Avoid Safety Concerns at Montana Tunnels Mine
Additional Information
Appendix A. Tool Tables and Checklists
Glossary
References
Acronyms
Acknowledgments
Team Contacts
Document Feedback


Click for Selection Tool Click for Summary Tables Click for Tool Descriptions Click for Case Studies Click for Checklists Click for Training Videos Click for Home

9.2 MIP Allows Real-Time Identification and Delineation of DNAPL Plume at a Former Naval Air Station in California

Eliot Cooper
Director of Technology Innovation
Gregg Drilling, Remediation Division
[email protected]
Information presented in this case study is based on investigations conducted by Shaw Environmental and Vironex Field Services

In 2010 the U.S. Navy engaged in remediation for Operable Unit (OU) 2B Installation Restoration Sites 3, 4, 11, and 21 at the Former Naval Air Station (NAS) Alameda in Alameda, California.  Site 4 (Aircraft Engine Facility) covers approximately 22.7 acres and includes Building 360, which was used for aircraft engine and airframe overhaul. Building 360 operations contributed to the existence of a large VOC plume located within OU-2B.  A portion of the plume located within Site 4, referred to as Plume 4, consists of two lobes that trend east-west through Site 4. The northernmost lobe of the plume is associated with source area 4-1.

Despite years of groundwater sampling indicating the presence of DNAPL, DNAPL could not be located or identified, impeding overall remediation of a Plume 4. Because the probability of sufficiently defining both the vertical and horizontal extent of a DNAPL zone with traditional sampling is low, site characterization was perfomed using a MIP advanced by direct-push drilling. This was followed by continuous soil core sampling and use of Sudan dye to help identify the presence of a high TCE mass (see Figure 9‑2) and, if identified, determine if this mass was DNAPL.

The MIP uses up to four detectors (PID, FID, ECD and XSD) to respond to volatile chlorinated solvent contaminants. These detectors provide responses as eV that can be used to assess the amount of contaminant mass in the subsurface. Based on years of experience in logging chlorinated solvent sites and corresponding traditional soil and groundwater sampling, levels greater than 1 x 10⁶ to 1 x 10⁷ uV from the PID detector may indicate contaminant mass at DNAPL levels.

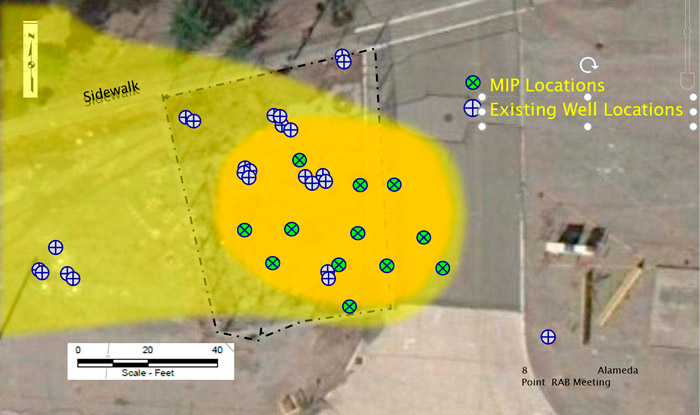
Figure 9‑2. Locations of existing wells and MIP borings in assumed source (dark yellow) and plume (light yellow).

Based on the level of responses of both the ECD (>1.4 x 10⁷ uV) and PID ( >1 x 10⁶ to 1 x 107 uV), a potential DNAPL zone was identified from approximately 15- to 22-ft below ground surface (see Figure 9‑3 and Figure 9‑4).

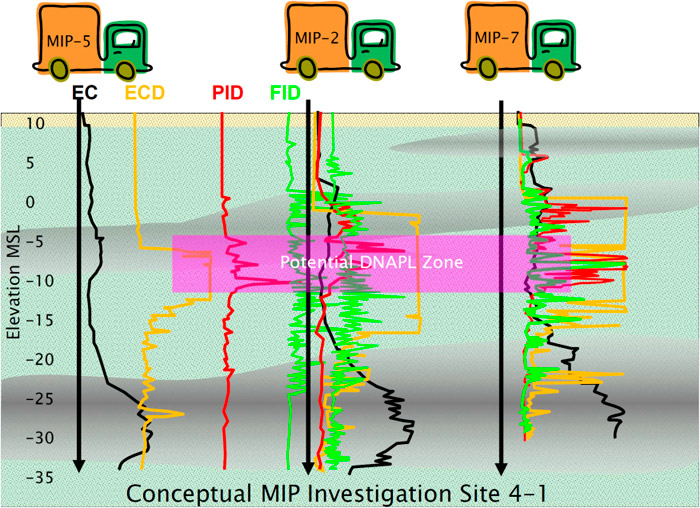
Figure 9‑3. Potential DNAPL interval identified by ECD and PID tools.

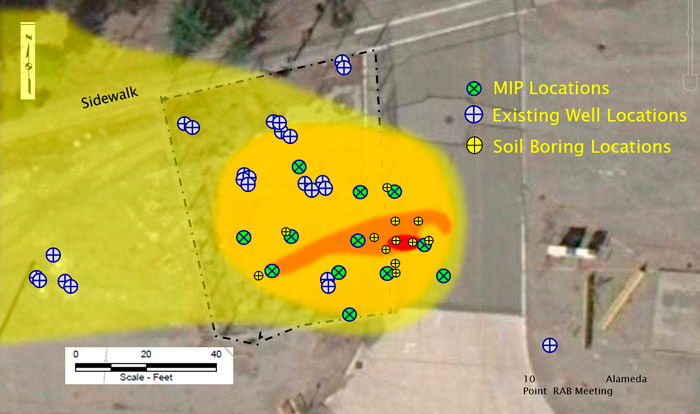
Figure 9‑4. Identified source core (light red) and DNAPL area (dark red).

Following the MIP screening, discreet groundwater samples were collected from the high-PID-response depth intervals (see Figure 9‑5). Based on these results, corresponding soil samples were collected (see Figure 9‑6) and DNAPL was confirmed through staining with Sudan red dye (see Figure 9‑7).

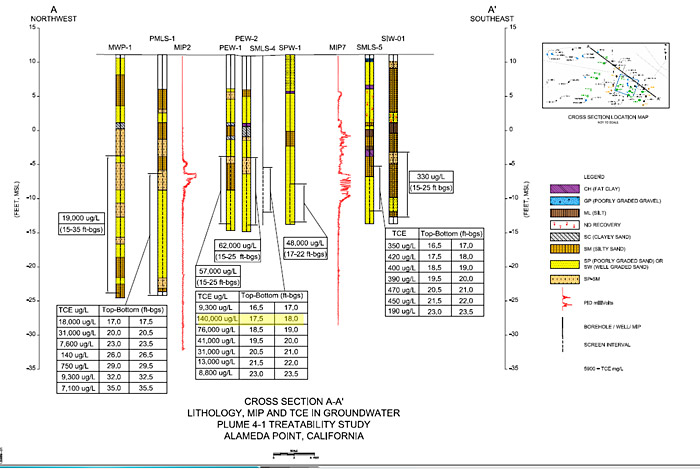
Figure 9‑5. TCE Groundwater concentrations in µg/l.

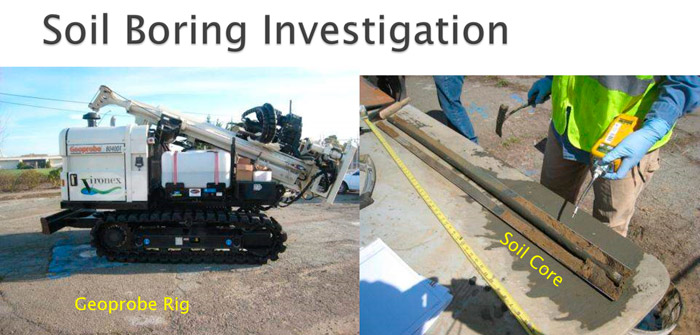
Figure 9‑6. Soil core collection with Geoprobe DT8040.

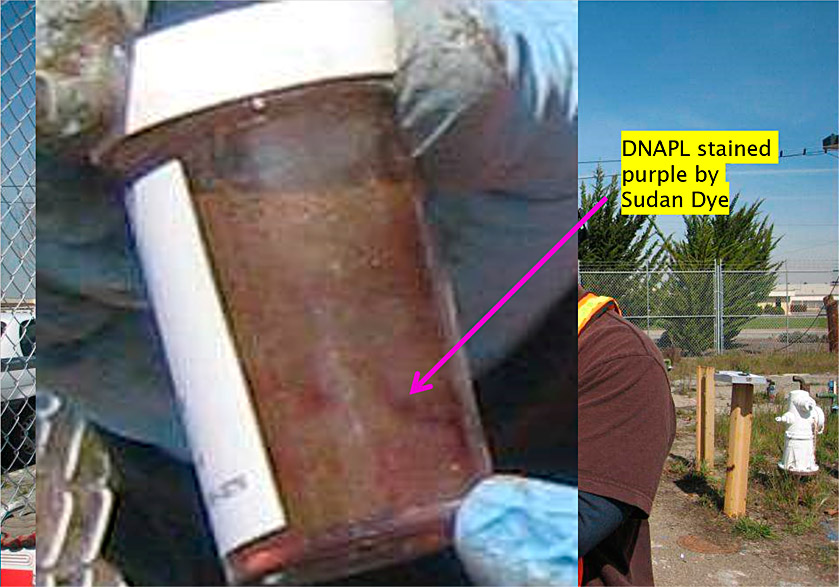
Figure 9‑7. Sudan Dye staining indicating TCE DNAPL.

Previous attempts to locate the suspected TCE DNAPL source area were costly and unsuccessful. The cost associated with this integrated approach provided an excellent return on characterization investment. After identifying the TCE DNAPL source zone, a targeted DNAPL treatment strategy was applied, leading to expedited cleanup of the source area and plume.

image_pdfPrint this page/section
Click here to download the entire document.


ASCT-1

web document
glossaryASCT-1
Glossary
referencesASCT-1
References
acronymsASCT-1
Acronyms

ITRC
Contact Us
About ITRC
Visit ITRC
social media iconsClick here to visit ITRC on FacebookClick here to visit ITRC on TwitterClick here to visit ITRC on LinkedInITRC on Social Media
Permission is granted to refer to or quote from this publication with the customary acknowledgment of the source (see suggested citation and disclaimer). This web site is owned by ITRC • 1250 H Street, NW • Suite 850 • Washington, DC 20005 • (202) 266-4933 • Email: [email protected] • Terms of Service, Privacy Policy, and Usage Policy ITRC is sponsored by the Environmental Council of the States.