
9.17 Drone Technology Expedites and Streamlines Site Characterization at a Former Golf Course in Missouri
| Mike Rawitch Ramboll US Corporation Overland Park, KS [email protected] |
A former golf course in Missouri ceased operation in the middle to late 2000s and remained vacant for more than a decade. At the time of the investigation typical golf course features such as greens, tee boxes, and stockpiles were not readily observable. The purpose of the investigation was to determine the nature and extent of arsenic, lead and mercury contamination previously detected in samples from the greens, putting green, tees, fairway, driving range, and pitch-and-putt course to complete the site characterization. In July 2018, a site characterization was conducted to determine the nature and extent of arsenic, lead, and mercury contamination previously detected in samples from the greens, putting green, tees, fairway, driving range, and pitch-and-putt course. A drone with a visual camera was used to help identify key on-site features through spatial referencing and document visuals prior to and after soil removal. A web-based GIS system allowed field teams and office staff to access collected data quickly.
High-resolution aerial photographs of the site were collected with a DJI Phantom 4 Pro, a multirotor quadcopter. Prior to flight operations, Skyward (Drone Fleet Management software) was used to ensure compliance with FAA guidelines in 14 CFR part 107 (FAA 2018). Data collection planning and processing were accomplished using the cloud-based processing software DroneDeploy. The flight plan was developed and included considerations such as avoiding nearby residences and trees that obscured visual line-of-sight.
The survey was limited to the approximate property boundaries (228 acres). Data collection resulted in 563 individual perpendicular aerial images and several dozen oblique aerial photographs. The perpendicular images were processed to create a single high-resolution orthomosaic of the site. Additionally, these images were processed using photogrammetric methods to create a digital surface model. Accuracy was reported as root mean square error of approximately 53 inches for the optimized camera location in XYZ coordinates. The absolute accuracy was calculated as the root mean square error of the difference between the image location recorded by the navigational GPS and the corrected image location calculated during map processing in the X, Y, and Z plane. The ground sampling distance of the imagery captured was approximately 1.3 inches per pixel.
The processed orthomosaic imagery was brought into a web-based/mobile GIS platform (ArcGIS Online) using a Web Tile Layer created by DroneDeploy to allow the imagery to be viewed on an iPad Pro with a Bluetooth connection to a Trimble R1 global navigation satellite system (GNSS) receiver. This setup supports submeter location accuracy for the sample points directed by the imagery data. Field teams collected soil samples informed by the drone data, which were provided as a mobile GIS map. The collected samples were used to inform and direct excavation. Postexcavation, a second imagery dataset was captured. The combined dataset supported a GIS presentation of the site postexcavation. A replicate drone survey was performed following the excavation activities. The soil from the excavations was consolidated into four stockpiles for ease of loading for disposal. DroneDeploy was used to estimate the volume of the soil stockpiles and to denote the locations of excavation areas apparent on orthoimagery. The volume of the four stockpiles was estimated at approximately 301 cubic yards.
Anecdotal information suggested that, as part of previous remediation efforts, the golf greens were scraped and the excavated soil was stockpiled on the northern portion of the site. To locate these potential stockpiles, a drone was used to collect visual images. The images were examined, and photogrammetric analysis revealed no elevated areas indicative of soil stockpiles or areas of obvious tone or texture differences indicative of soil disturbance. Additionally, high-resolution orthoimagery was integrated into mobile GIS to assist in confirming sample locations and their relative location to historic course features (see Figure 9‑62, Figure 9‑63 and Figure 9‑64 for example images).
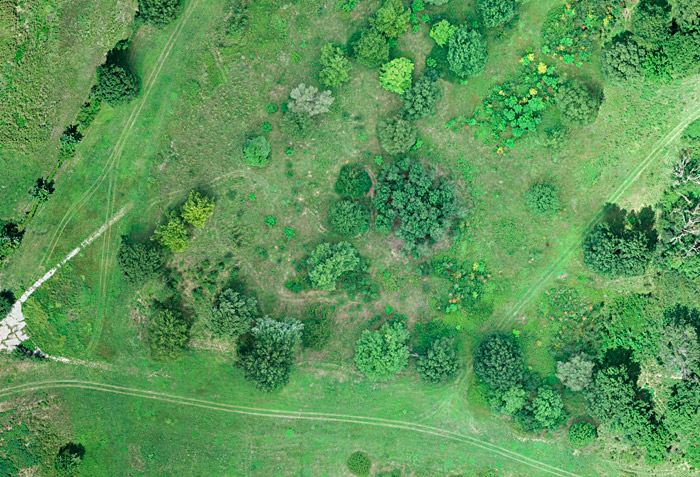
Figure 9‑62. Pre-excavation site characterization of one area where soil removal was documented
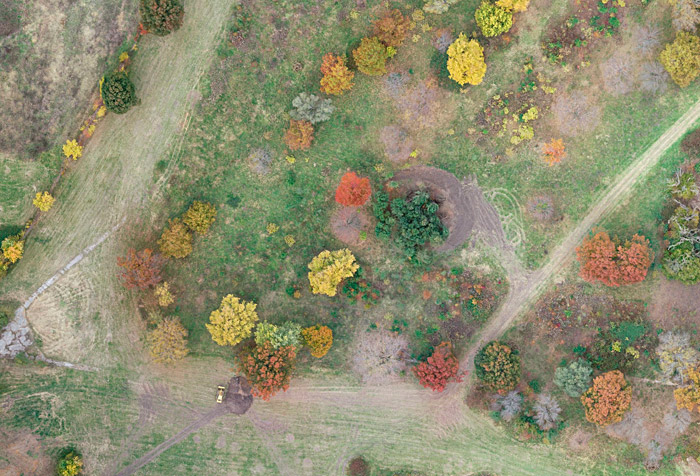
Figure 9‑63. Postexcavation of one area with soil stockpile next to equipment
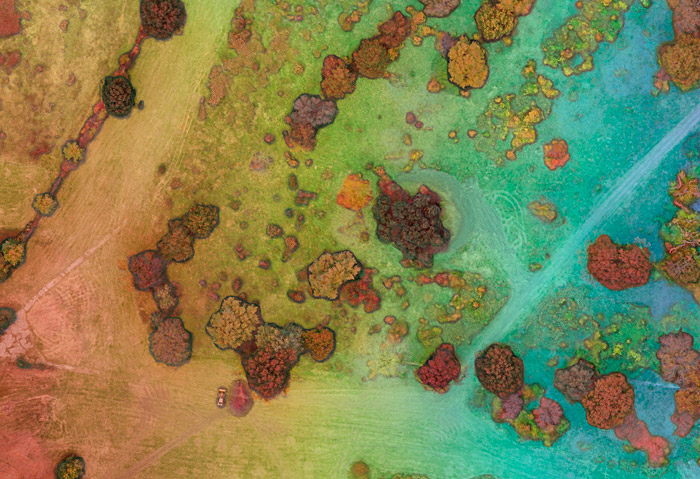
Figure 9‑64. Postexcavation digital surface model with soil stockpile next to equipment
Site closure was achieved in early 2019. While the site could have been inspected on foot and supported by older aircraft or satellite images, using a drone with a visual camera provided distinct advantages, including, but not limited to, the following:
- Speed: The 228-acre site was surveyed in a matter of a few hours.
- Detail: Certain areas of the site were difficult or impossible to access on foot and, even if the site were canvased on foot, findings would have been difficult to document.
- Collaboration: The data were made available for all interested parties to review. Data were easily shared between the teams conducting activities in the field and the office, which allowed for efficient remedial and characterization efforts the field team to remain oriented to site features during the characterization.
When compared to reviewing aerial imagery alone, the method used provided distinct advantages, including, but not limited to, the following:
- Spatial resolution: The ground sampling distance of 1.3 inches is a much finer spatial resolution than available with traditional aerial imagery.
- Temporal resolution: The ability to fly the drone immediately before characterization and after soil remediation activities provided visual documentation of the completed work.
In total, the effort cost approximately $2,500, including developing a flight plan, collecting samples (bulk of the effort), uploading data for cloud-based processing, paying fees associated with remotely piloted aircraft system (RPAS) equipment and data processing, performing a quality review of processed data, and conducting analysis and interpretation. Analysis and interpretation included the identification of historical features, integration into mobile/web-based GIS, and measuring of stockpiles postremediation. The total cost does not include mobilization to the site or additional reporting efforts beyond the initial characterization.
An estimate of costs to survey the entire 228 acres on foot would be on the order of $5,000 to $10,000. In addition to these avoided costs, the costs avoided by applying this technology and improving efficiencies are intangible but most definitely beneficial.
Click here to download the entire document.

