3.3 Optical Image Profiler
The OIP, manufactured and marketed by Geoprobe Systems®, is a field-screening tool used for characterizing the subsurface distribution of products (NAPL) containing polycyclic aromatic hydrocarbons (PAHs). The system provides qualitative to semiquantitative results for product and PAHs levels in the bulk formation. The OIP system employs a 275-nanometer (nm) UV light-emitting diode (LED) to induce fluorescence in PAHs, a visible (white) light (VIS) LED to examine the media, and an integrated camera to capture images of both. Each of these instruments are housed opposite a sapphire window within a 2-ft-long, 2-inch-diameter probe. Fluorescence is logged as a percent area of the camera’s field of view or “percent% area of fluorescence.” The system is deployed using either direct-push technology with hydraulic hammer or a CPT unit.
The OIP-UV takes advantage of the fact that PAHs fluoresce in the presence of UV light (Lakowicz 1999). The UV light causes electrons in the molecules to jump to a higher energy state and, after a short period of time, the electrons return to the normal, lower-energy state by releasing a photon of light (fluorescing). Light is released by these molecules at specific wavelengths depending on the compounds being excited. Smaller PAH molecules, such as naphthalene, emit shorter wavelengths while larger molecules emit longer wavelengths. In all cases, the light emitted by these molecules is of a longer wavelength than the exciting source (Aldstadt 2002). Naphthalene emissions are primarily in the UV range. For mixtures containing larger PAH molecules, fluorescence occurs at visible wavelengths (Berlman 1971); (Dixon 2005) (see Section 3.4 for a more in-depth description). The OIP camera cannot detect most UV emissions, but is sensitive to emissions in the visible portion of the EM spectrum. An OIP probe equipped with a green wavelength (520 nm) laser diode is available to detect coal tars and creosote. These heavier compounds do not fluoresce or fluoresce only weakly under UV light but do fluoresce well under the green light source.
The OIP-UV is primarily used to identify the presence and distribution of hydrocarbon LNAPL such as gasoline, diesel fuel, used motor oil, and similar compounds in contaminated subsurface soils and sediments. OIP-UV can also be used to estimate certain physical properties of overburden materials. The device also is equipped with a VIS LED to provide images of soil texture and color at selected depths, which allows grain-size distribution and permeability to be estimated. The system does not allow the user to discriminate between types or mixtures of LNAPL present (for example, gasoline versus diesel versus jet fuel); therefore, some prior knowledge of the type of release is required (McCall, Christy, Pipp, Jaster, Bean, et al. 2018).
3.3.1 Tool Description
The OIP system consists of a probe, the field instrument, optical interface, and laptop computer (see Figure 3‑6 and Figure 3‑7). The field instrument interfaces with, provides power to, and allows data transfer from an EC dipole mounted on the probe and a string potentiometer located at the surface. The string potentiometer is mounted to the direct-push unit and provides information on probe depth and push rate. The optical interface delivers power to the downhole camera and LED and transmits images to the laptop computer for analysis. A trunk line connects the probe directly to the optical interface (McCall, Christy, Pipp, Jaster, White, et al. 2018).
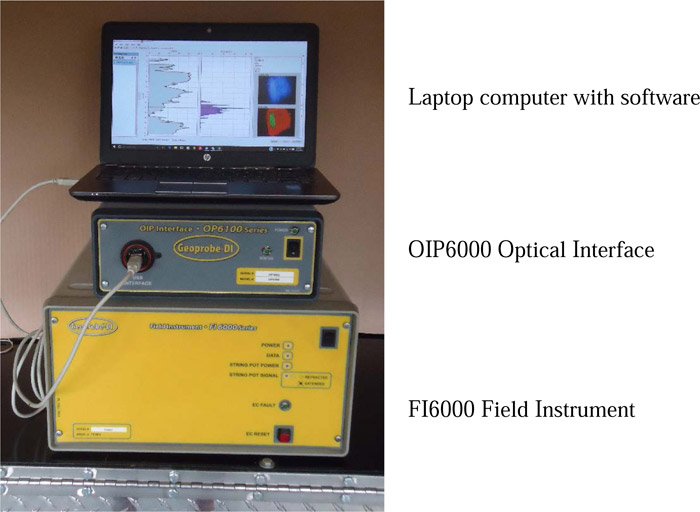
Figure 3‑6. Aboveground OIP system components.
Source: Geoprobe Systems®, Used with permission
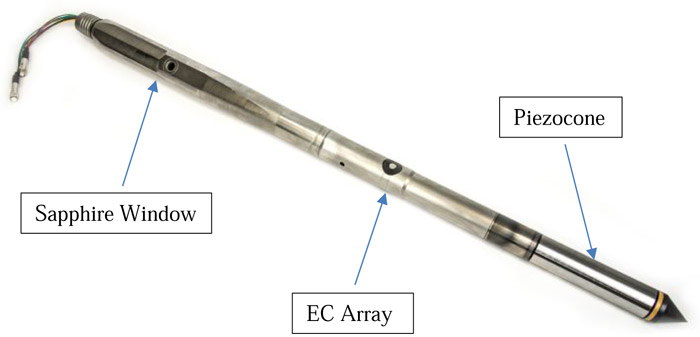
System operation is straight forward. The OIP probe is advanced using direct push percussion probing methods into soils and unconsolidated formations at a rate of approximately 2 cm/sec (4 ft/minute). The standard probe (see Figure 3‑7) used during petroleum investigations, is equipped with both UV (275 nm) LED (UV LED) and a visible spectrum (VIS) LED stationed behind a sapphire window. Either of these LEDs may be used to illuminate the formation outside the sapphire window. To capture the illuminated image, a small complementary metal-oxide semiconductor camera is mounted behind the window, inside the probe. As the probe is advanced, the camera captures images of fluorescence at 30 frames/sec. One image is saved for every 0.05 ft (~15mm) of probe advancement. The system operator can halt probe advancement at any depth and capture a still fluorescence or VIS image. Still images provide better clarity and detail than images captured as the probe is advancing. VIS images may help to define formation texture, structure, and color. As the probe is advanced, an integrated EC array provides real-time readings of the EC of the formation.
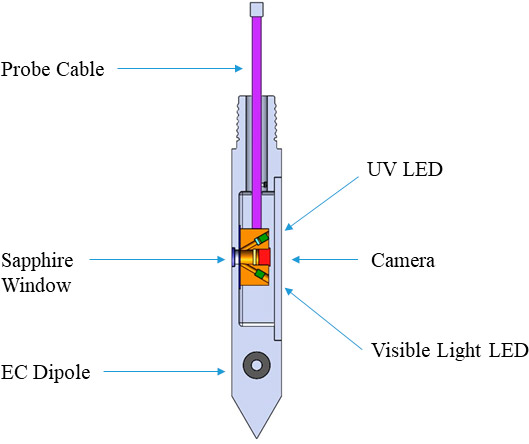
Figure 3‑7. Standard OIP-UV probe with integrated EC array (The OIP-G probe is configured with a Green LED instead of the UV LED, and an Infra-Red LED instead of the Visible Light LED.).
Source: Geoprobe Systems®, Used with permission
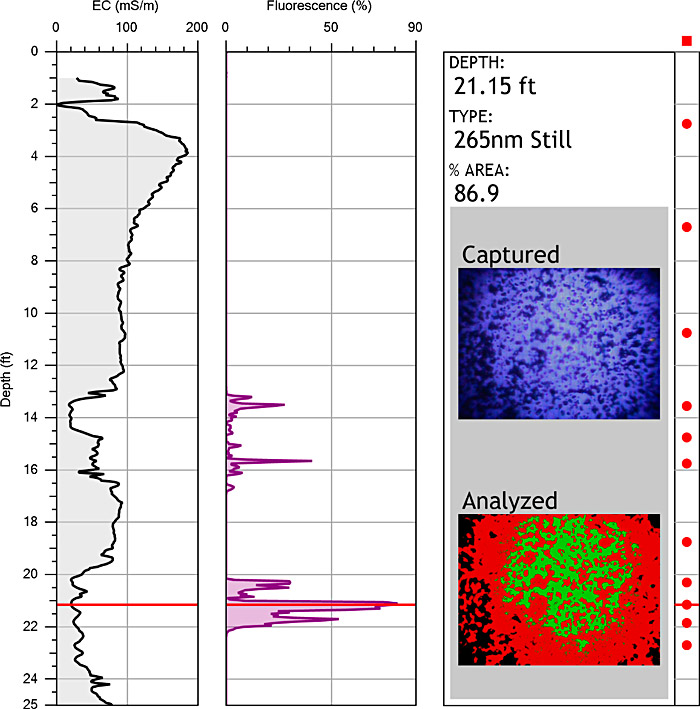
The left side of Figure 3‑8 shows the EC and percent area of fluorescence logs versus depth; the right side presents captured still images. The UV images, both still and dynamic, are analyzed by software and displayed on a laptop computer for interpretation in the field. As seen in Figure 3‑8, the captured image represents the unfiltered image as detected by the complementary metal-oxide semiconductor sensor. The analyzed image is what remains of the unfiltered image following the application of digital filters. These filters eliminate pixels that are unrepresentative of fuel fluorescence. The average area illuminated per frame is calculated using multiple filtered frames obtained over a 0.05-ft interval to calculate the percent area of fluorescence which is then plotted on the log.
Figure 3‑8. OIP software display.
Source: Geoprobe Systems®, Used with permission
OIP data are rarely viewed in isolation but combined with information obtained from complimentary sensors. All OIP probes are equipped with a small dipole EC array near the end of the tool to acquire logs of bulk formation EC as the probe is advanced (see Section 3.5). Most OIP probes can be fitted with a HPT port to conduct injection logging. Information from these sensors can be viewed together with the OIP percent area of fluorescence data and EC log information. In addition, OIP probes can be fitted with a CPT cone (see Section 3.5) to obtain information on soil type and material strength (see Figure 3‑9).
Figure 3‑9. OIP probe with attached CPT cone.
Source: Geoprobe Systems®, Used with permission
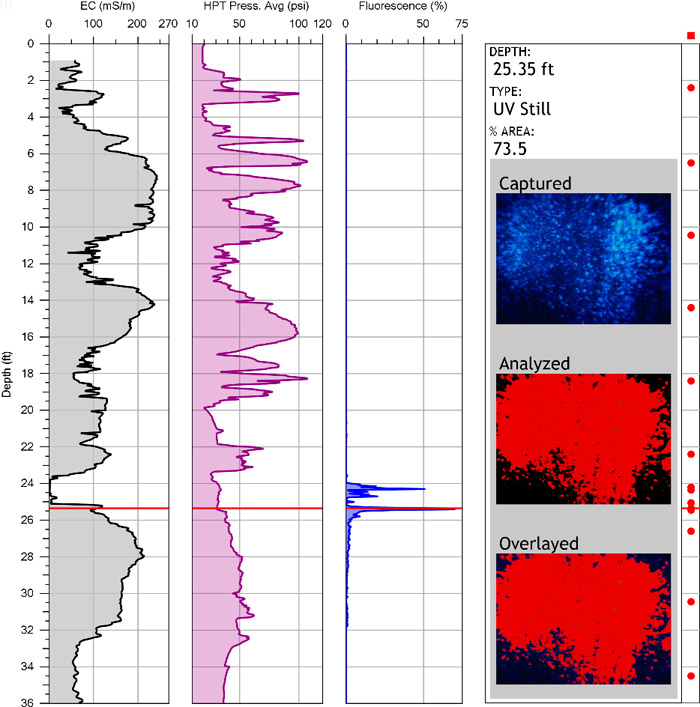
Tandem HPT logging is used to provide a pressure log versus depth to help evaluate formation permeability (see Section 3.6.1.1). Viewing these logs alongside the OIP fluorescence logs can help to better define contaminant migration pathways or low permeability back-diffusion sources. In Figure 3‑10, the low EC (see Section 3.7) and low HPT pressure (see Section 3.6) from about 23.5 ft to 25 ft indicate the presence of a dry sand (not water wet). The image of fluorescence at 25.35 ft indicates the presence of LNAPL globules in the formation. The percent fluorescence log shows that NAPL is present in the sandy layer bounded above and below by silty clays. These data indicate that the sandy layer is behaving as a migration pathway for the LNAPL at this site.
Figure 3‑10. An OIP-HPT log with (EC on left, HPT injection pressure on middle, and percent area of fluorescence on right).
Source: Geoprobe Systems®, Used with permission
Coal tars, creosote, and some heavy fuels do not fluoresce consistently under UV illumination but do fluoresce under green wavelength light. An OIP probe, the OIP-Green (OIP-G), has been designed with a green (525nm) laser diode for investigation of these contaminants. Because of the low pass filter used over the camera to exclude the green source light, this probe is equipped with an infrared (IR) LED to view soil texture and structure at selected depths. The operational process for the OIP-G probe is the same as described above for the OIP-UV system.
3.3.2 Technical Limitations
The ability of the OIP to detect various contaminants depends on a variety of physical and chemical factors. Interferences, such as mineral fluorescence, can cause false positive results. Confirmatory sampling and analysis is needed when using the OIP data to assist with interpretation of these potential interferences, as well as to compare soil sample concentrations to the fluorescence response results. These technical limitations are discussed in the subsections below.
3.3.2.1 Detection Limits
OIP sensitivity depends on chemical characteristics, the soil type, and other factors. The OIP cannot detect disseminated or dissolved contamination; it only detects NAPL phase. NAPL that is PAH deficient may exhibit little to no fluorescence signature. The detection level for gasoline is higher than that for diesel, crude oil, or motor oil due to lower PAH concentrations (McCall, Christy, Pipp, Jaster, White, et al. 2018). Weathering and biodegradation of the product often result in lower levels of fluorescence and, therefore, higher detection limits. With the OIP-UV system products that are PAH rich with heavier molecular weight compounds may also exhibit reduced fluorescence due to quenching.
LIF response tends to be stronger in coarser-grained materials and weaker in fine-grained materials such as clay (Apitz et al. 1993) (see Section 3.4). The OIP, as a fluorescent-based detection tool, is likely to be similarly affected by grain size. OIP fluorescence data does not provide an indication of product type (for example, gasoline versus diesel versus jet fuel); sampling and analysis are required to specifically identify the product present in the subsurface.
Pure chlorinated contaminants are invisible to the OIP because chlorinated NAPL do not fluoresce under UV, unless they are mixed with PAHs (such as degreasing wastes). Chlorinated DNAPL can be detected with dye LIF (see Section 3.4.1.3), and chlorinated VOCs, including DNAPL, can be detected with the MIP (see Section 3.2).
3.3.2.2 Interferences
Natural and manmade materials fluoresce and potentially result in false positive results. Probably the most common natural interferant is calcite, a mineral in limestone, seashells, and caliche soils. Calcite fluorescence appears to be minimal under OIP-UV illumination. Soil sampling is required to verify if false positive fluorescence is observed with the OIP system. Many manmade materials (for example, paper and plastics) fluoresce, so investigations at landfills or similar facilities may be challenging. (see Section 3.3.3.2 for further discussion).
3.3.2.3 Confirmatory Sampling
Because the OIP is a screening tool, some form of confirmatory soil sampling and analysis is recommended. Using log data to target specific locations and depth intervals to collect confirmatory samples is recommended. Samples should be collected from high, moderate, and low fluorescence intervals as well as a few nondetect zones. Confirmation of OIP results using traditional, fixed-based sampling methods may be problematic because NAPL distribution tends to be in the form of diffuse ganglia or through preferential pathways in heterogeneous materials. In most case, the goal is to determine whether the OIP results indicate the presence of product in the same area as samples collected and analyzed in a laboratory. A specific OIP sample cannot be used to determine site contamination; a larger picture of contamination based on multiple samples is the goal. Therefore, confirmatory samples should be collected to confirm the presence of NAPL generally and, perhaps, not to directly compare paired, colocated samples. Quantitative correlation of OIP and other chemical log data to laboratory analysis of samples is often low due to several factors, including, but not limited to, the differences in analytical methods and qualitative nature of in situ tests compared to rigorous quantitative laboratory procedures. Furthermore, a core sample taken only 0.5 m from the log location may have a different NAPL distribution due to heterogeneity challenges discussed previously.
3.3.3 QA/QC
QA/QC standards must be established and followed to ensure reliable data. QC should be performed during and after each log is generated and care should be taken to ensure that the operator is performing the necessary QC tasks. In addition to comprehensive operator training (which may be verified prior to commencing work) and an operator track record of successful use, approved field procedures must be understood and followed before, during, and after OIP logging activities. The manufacturer’s SOP must be reviewed prior to initiating field work (Geoprobe 2019).
3.3.3.1 QA Prior to Use
Site conditions, the type of subsurface contamination, and the project objectives should be evaluated to determine if OIP is the appropriate tool. One such evaluation can include collection of NAPL and soil samples prior to initiating field work to test and assess NAPL response and the potential for false positives and background interference. Another important pre-mobilization consideration is determination of how probe refusal will be defined for the site. Many investigations using direct-push technologies define refusal as an advancement rate (plotted on screen) below 0.5 ft/minute.
The equipment operator should complete all required QA tests prior to advancing the OIP in accordance with the manufacturer’s SOP (Geoprobe 2019). These tests assure that the probe is undamaged prior to use, that interferences are absent, and that the probe sensor is responding appropriately to reference standards. QA test data obtained prior to beginning work should be saved to a log file and should include all images and fluorescence responses to known products tested. The file may be reviewed any time after logging is completed. Typically, the same QA test sequence is performed after each log is completed (or at least after the last log of the day) to verify data quality for the final log. QA test data obtained after logging should also be saved to a log file.
3.3.3.2 QC During Use
When using the OIP, frequent communication between the probe machine operator and OIP operators is the primary key to success. The OIP and probe operators should agree on verbal commands and hand signals to alert the probe operator when to halt probe advancement so still images can be captured. Good still images in zones of high fluorescence (UV and VIS) or where lithology changes occur (VIS) are valuable when reviewing logs and ultimately developing the CSM.
Real-time images of fluorescence are displayed on screen as the OIP probe is advanced. These images may be used to confirm the indicated presence or absence of fluorescence plotted in the percent area of the fluorescence log. The fluorescence images on screen (and saved to file) are dark if fluorescence is absent. For fuel investigations, the OIP-UV-generated images show blue light typical of fuel fluorescence. Occasionally, fluorescent light of a wavelength outside of that defined for fuels under OIP-UV may be observed but the digital filters in the software do not recognize this fluorescent light as a contaminant of concern. Unfiltered images are captured at a rate 30 frames/sec and saved at a rate of one image/0.5 ft of probe advancement. Multiple (unsaved) images obtained over the 0.05 ft interval are processed (filtered and averaged) to obtain the percent area of fluorescence for that interval (McCall, Christy, Pipp, Jaster, White, et al. 2018).
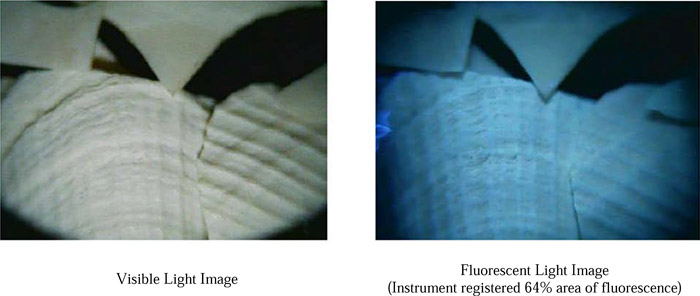
In some cases, viewing the images of fluorescent light and visible (reflected) light or infrared images may help to identify materials causing false positive responses. The UV and tandem VIS (OIP-UV only) or infrared (OIP-G only) images may help identify objects with identifiable shapes or patterns in the subsurface, such as paper or seashells (see Figure 3‑11). Caliche nodules in soils can develop and may have a characteristic shape and size that differs from fluid products. Targeted sampling at some locations may be needed to verify materials suspected of causing false positive responses.
Figure 3‑11. Bench-scale test images of seashell chips as seen under visible (left) and UV (right) light using OIP sensor.
Source: Geoprobe Systems®, Used with permission
3.3.3.3 QC After Use
A response check is run before and after each log run, including the last run of the day. QC tasks after using the OIP include inspecting the tool window for damage and contamination, checking to ensure that the camera frame rate is not consistently low, checking consistency between response tests, and verifying that no contamination is present on the optical window or inside the optical cavity by checking the focus and clarity of the visual image test, and verifying a non-detect response on the and black box test (Geoprobe 2019). In addition, occasionally performing replicate log runs to verify repeatability and collecting targeted confirmation soil samples for analysis is part of the post-log QC process.
3.3.4 Tool and Data Misuse
The OIP provides photographic images of NAPL fluorescence in situ. These images can provide photographic verification of PAH fluorescence in the subsurface and some indication of the relationship between the fluorescent NAPL and the formation matrix and the NAPL distribution in the formation (for example, suspended droplets, blebs, ganglia, massive saturation in the pore space). The OIP is unable to detect NAPL that are significantly PAH deficient (for example, chlorinated NAPL) and should not be used for this purpose.
Because various factors can affect OIP response, care should be taken to prevent overly simplistic interpretations when reviewing logs. The formation and any contained NAPL are disturbed and compressed when the probe is advanced into the formation. This disturbance and compression may lead to local increases in NAPL-saturated pore space at the sapphire window. Thus, the images (and resultant percent area of fluorescence log) may overestimate the amount of NAPL observed at any given depth. Conversely, soft clays may smear over the sapphire window and block the fluorescence of small amounts of NAPL. Confirmatory sampling can help to verify these misrepresentations if they occur.
3.3.5 Case Studies
The following case study describes the use of the OIP:
Click here to download the entire document.

